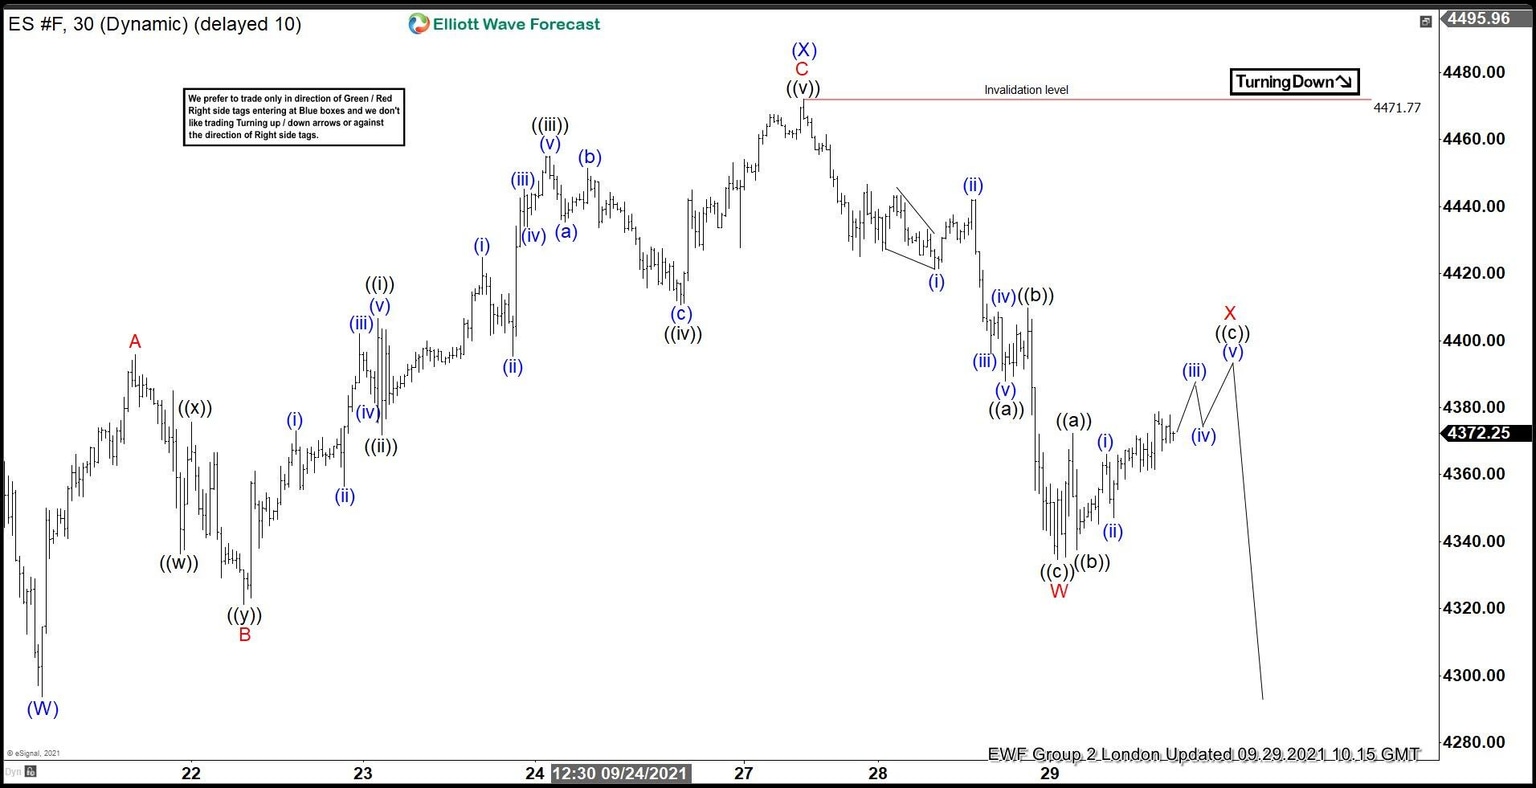
In this technical blog we’re going to take a look at the Elliott Wave charts charts of S&P 500 Futures $ES_F published in members area of the website. As our members know $ES_F is giving us pull back ((4)), which is correcting the cycle from the 24th September low. Recently the futures found sellers after completing short term recovery as Elliott Wave Zig Zag. In further text we’re going to explain the forecast and Elliott Wave Patterns.

Before we take a look at the real market example, let’s explain Elliott Wave Zigzag.

Elliott Wave Zigzag is the most popular corrective pattern in Elliott Wave theory . It’s made of 3 swings which have 5-3-5 inner structure. Inner swings are labeled as A,B,C where A =5 waves, B=3 waves and C=5 waves. That means A and C can be either impulsive waves or diagonals. (Leading Diagonal in case of wave A or Ending in case of wave C) . Waves A and C must meet all conditions of being 5 wave structure, such as: having RSI divergency between wave subdivisions, ideal Fibonacci extensions and ideal retracements.

Chart

$ES_F 1 hour Elliott Wave analysis 9.23.2021

Wave (X) blue correction can be in progress as Elliott Wave Zig Zag pattern. First leg of the (X) bounce has subdivision in 5 waves. Then we got 3 waves pull back B red . Now ideally doing 5 waves up in C red. We expect to see more short term strength in SP Futures. Approximate area where (X) blue connector can complete comes at the A-B red equal legs : 4424.3-4488.8. From that zone we expect to see another leg down. There is no incomplete bearish sequences at the moment, and we don’t recommend selling.

Chart

$ES_F 1 hour Elliott Wave analysis 9.23.2021

Recovery made 5 waves in C red leg as we expected. $ES_F completed Elliott Wave Zig Zag Structure at 4471.77 high. At the moment we are getting 3 waves recovery in short term X red connector. As far as the price holds pivot at 4471.77 high in place , the futures can see more weakness in (Y) blue leg. We need to see break of (W) blue low -09/20 to confirm next leg down is in progress.

Chart

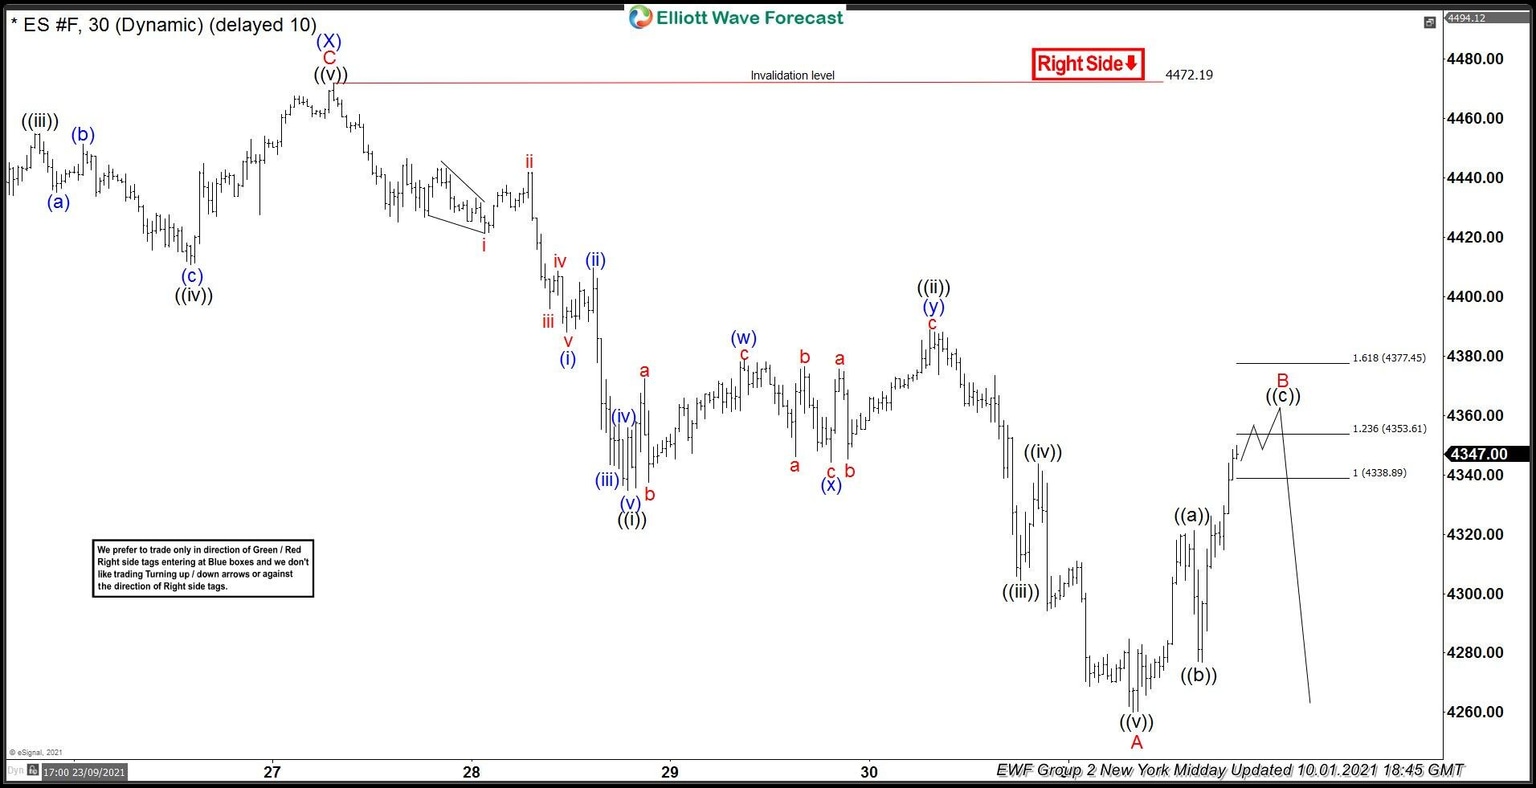
$ES_F 1 hour Elliott Wave analysis 10.01.2021

We got further decline after 3 waves bounce. Eventually the price has broken 09/20 low , making lower low sequences. That made $ES_F bearish against the 4472.19 high in near term, targeting 4214.8-4154.3 area. Short term recovery can be ending soon at 43338.8-4377.4 area.

Chart

FURTHER DISCLOSURES AND DISCLAIMER CONCERNING RISK, RESPONSIBILITY AND LIABILITY Trading in the Foreign Exchange market is a challenging opportunity where above average returns are available for educated and experienced investors who are willing to take above average risk. However, before deciding to participate in Foreign Exchange (FX) trading, you should carefully consider your investment objectives, level of xperience and risk appetite. Do not invest or trade capital you cannot afford to lose. EME PROCESSING AND CONSULTING, LLC, THEIR REPRESENTATIVES, AND ANYONE WORKING FOR OR WITHIN WWW.ELLIOTTWAVE- FORECAST.COM is not responsible for any loss from any form of distributed advice, signal, analysis, or content. Again, we fully DISCLOSE to the Subscriber base that the Service as a whole, the individual Parties, Representatives, or owners shall not be liable to any and all Subscribers for any losses or damages as a result of any action taken by the Subscriber from any trade idea or signal posted on the website(s) distributed through any form of social-media, email, the website, and/or any other electronic, written, verbal, or future form of communication . All analysis, trading signals, trading recommendations, all charts, communicated interpretations of the wave counts, and all content from any media form produced by www.Elliottwave-forecast.com and/or the Representatives are solely the opinions and best efforts of the respective author(s). In general Forex instruments are highly leveraged, and traders can lose some or all of their initial margin funds. All content provided by www.Elliottwave-forecast.com is expressed in good faith and is intended to help Subscribers succeed in the marketplace, but it is never guaranteed. There is no “holy grail” to trading or forecasting the market and we are wrong sometimes like everyone else. Please understand and accept the risk involved when making any trading and/or investment decision. UNDERSTAND that all the content we provide is protected through copyright of EME PROCESSING AND CONSULTING, LLC. It is illegal to disseminate in any form of communication any part or all of our proprietary information without specific authorization. UNDERSTAND that you also agree to not allow persons that are not PAID SUBSCRIBERS to view any of the content not released publicly. IF YOU ARE FOUND TO BE IN VIOLATION OF THESE RESTRICTIONS you or your firm (as the Subscriber) will be charged fully with no discount for one year subscription to our Premium Plus Plan at $1,799.88 for EACH person or firm who received any of our content illegally through the respected intermediary’s (Subscriber in violation of terms) channel(s) of communication.

Recommended Content


Recommended Content

Editors’ Picks

EUR/USD holds above 1.0650 after US data

EUR/USD holds above 1.0650 after US data

EUR/USD retreats from session highs but manages to hold above 1.0650 in the early American session. Upbeat macroeconomic data releases from the US helps the US Dollar find a foothold and limits the pair's upside.

EUR/USD News

GBP/USD retreats toward 1.2450 on modest USD rebound

GBP/USD retreats toward 1.2450 on modest USD rebound

GBP/USD edges lower in the second half of the day and trades at around 1.2450. Better-than-expected Jobless Claims and Philadelphia Fed Manufacturing Index data from the US provides a support to the USD and forces the pair to stay on the back foot.

GBP/USD News

Gold is closely monitoring geopolitics

Gold is closely monitoring geopolitics

Gold trades in positive territory above $2,380 on Thursday. Although the benchmark 10-year US Treasury bond yield holds steady following upbeat US data, XAU/USD continues to stretch higher on growing fears over a deepening conflict in the Middle East.

Gold News

Ripple faces significant correction as former SEC litigator says lawsuit could make it to Supreme Court

Ripple faces significant correction as former SEC litigator says lawsuit could make it to Supreme Court

Ripple (XRP) price hovers below the key $0.50 level on Thursday after failing at another attempt to break and close above the resistance for the fourth day in a row. 

Read more

Have we seen the extent of the Fed rate repricing?

Have we seen the extent of the Fed rate repricing?

Markets have been mostly consolidating recent moves into Thursday. We’ve seen some profit taking on Dollar longs and renewed demand for US equities into the dip. Whether or not this holds up is a completely different story.

Read more

Majors

Cryptocurrencies

Signatures