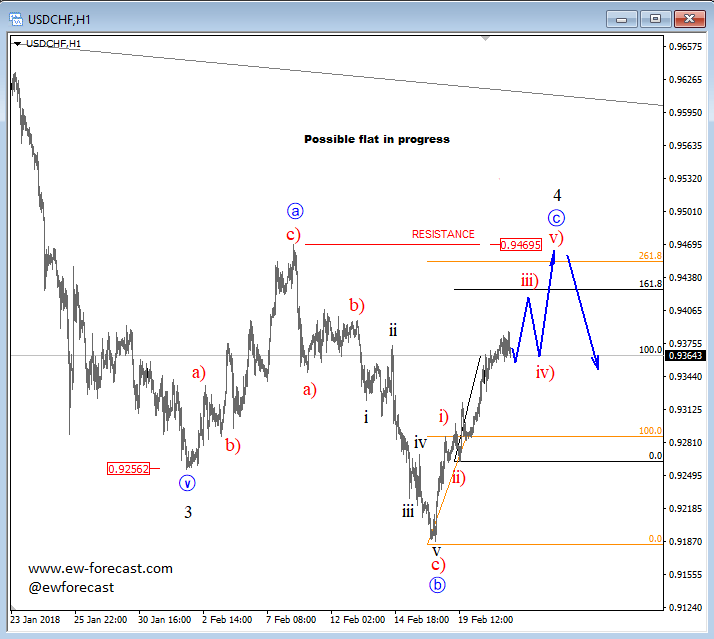
Elliott Wave Analysis: USDCHF In A Bigger Flat
USDCHF can be making a bigger flat correction on the hourly chart, where we see a completed three-wave rally within first leg a, followed by a three-wave decline within wave b and now sharp bounce from recent lows near 0.9200 can suggest final blue leg c to be in progress. We know that in a flat pattern we have a structure of a 3-3-5, meaning final wave c always needs to unfolds five waves. Here we can see this nicely developing, but now we only see three waves to the upside with red minor wave iii) leading the way. That said price can rally up towards the 0.9467/0.947 region, where an ideal resistance region can be seen, and a new turn lower can show up.
USDCHF, 1H
Disclosure: Please be informed that information we provide is NOT trading recommendation or investment advice. All of our work is for educational purposes only.
If you want more updates daily on different markets (FX, Gold, Silver, Oil, 10 year US notes, German Bund , Bitcoin, Dax, S&P500) then check our website for more detailsEW-Forecast.
Author

Gregor Horvat
Wavetraders
Experience Grega is based in Slovenia and has been in the Forex market since 2003.


