Elliott wave Analysis: Bulls Pushing S&P500 Higher

Hi traders,
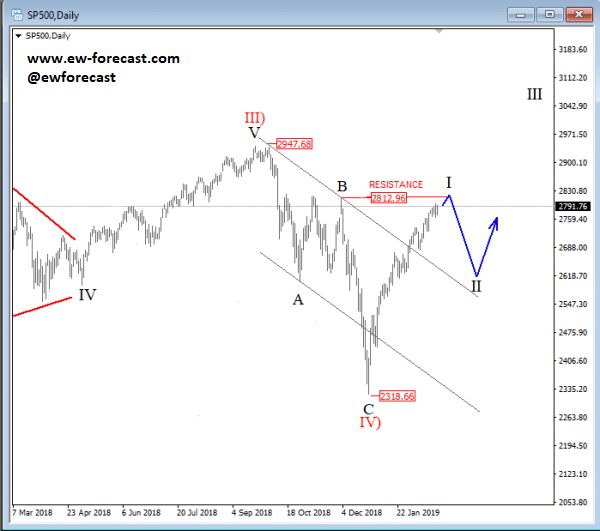
S&P500 has been trading in a corrective decline since September of 2018, and it unfolded a three-wave drop within higher degree wave IV). We can see that wave IV) found a base at the 2318 level, from where a new impulsive wave I of a bigger cycle had followed. This wave can now look for a temporary top near the 2813 level, where former swing high can react as resistance, and push price into a temporary pullback for wave II. The wave II pullback can later look for support near the upper line of a corrective channel (around 2600-2500 region), connected from 2947 level, and make a new bullish run into wave III of a higher degree.
S&P500, Daily
Interested in active FX or CRYPTO Elliott Wave labeled charts on a daily basis? Now its your time; we have Limited Offer; get a 14 day trial for 1€. Check our website at www.ew-forecast.com for more details.
Author

Gregor Horvat
Wavetraders
Experience Grega is based in Slovenia and has been in the Forex market since 2003.


