USD/JPY remains a range-driven, two-way trade
USD/JPY has become a range-driven tactical trade, with buyers and sellers both finding opportunities as the pair swings inside an established band.
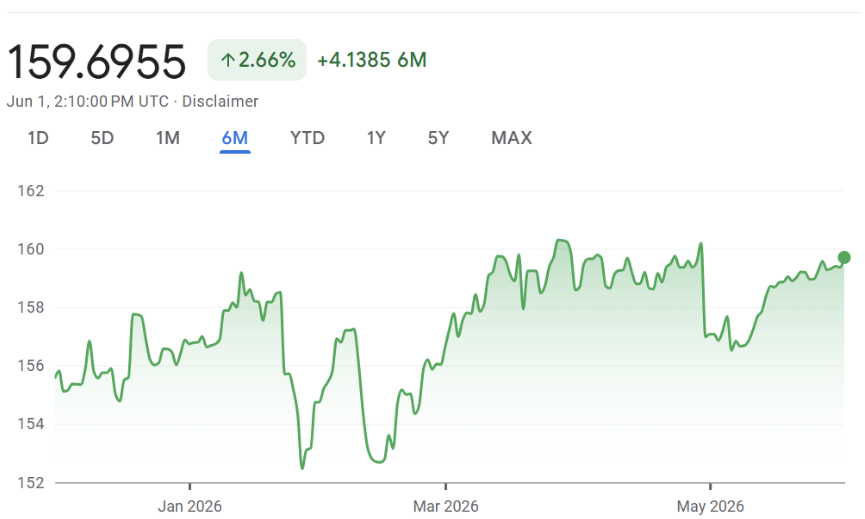
Over the last six months, the pair has largely traded between roughly 152.50 and 160.50. Rallies toward the upper end have revived the risk of Japanese intervention, while pullbacks have continued to attract dollar buyers supported by wide U.S.-Japan rate differentials, carry demand, geopolitical uncertainty and pressure on Japan from higher energy costs.
Recent price action has sharpened that setup. Over the last month, USD/JPY has mostly traded between roughly 156.50 and 160.00. With the pair now around 159.70, it sits near the upper end of both its short-term and six-month ranges. That raises the stakes: the next catalyst could either force a breakout or trigger another retracement if intervention risk, central bank expectations or geopolitical headlines shift against the dollar.
The June central bank calendar could provide that catalyst. The Bank of Japan meets June 15–16, followed by the Federal Reserve on June 16–17. If the BOJ hikes while the Fed holds, the yen could get a cleaner policy catalyst than intervention alone. But if the rate gap remains wide and uncertainty continues to support the dollar, buyers may keep stepping in on pullbacks.
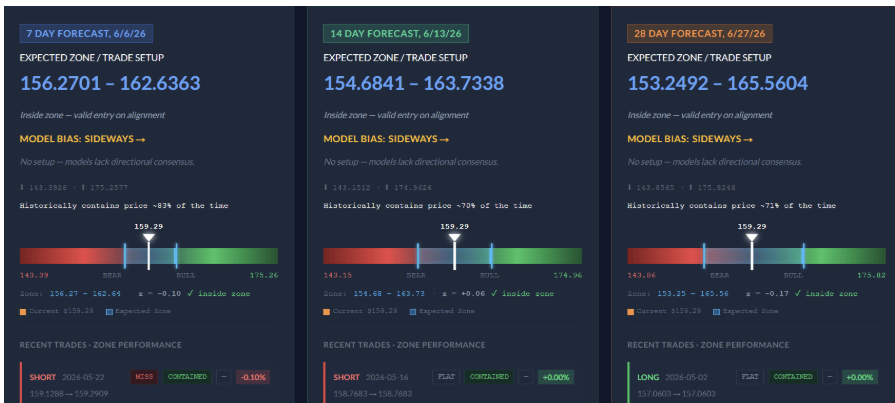
Sigmanomics data supports that two-way view. Across the 7-day, 14-day and 28-day horizons, the model shows sideways forecasts, with USD/JPY trading inside each expected zone. That reinforces the central point: the range itself remains the trade.
Why USD/JPY’s policy dynamics keep both sides in play
USD/JPY remains caught between two powerful forces: the dollar’s yield advantage and Japan’s efforts to limit yen weakness.
The dollar side of the trade still has a strong foundation. U.S. rates remain well above Japan’s, keeping the carry trade attractive for investors willing to hold dollar-yen exposure. Geopolitical uncertainty has also helped support demand for the dollar, while higher energy prices add another layer of pressure on Japan’s import-dependent economy.
Those forces have made yen strength difficult to sustain. USD/JPY can pull back sharply when intervention headlines hit or risk sentiment shifts, but buyers have often returned before those moves develop into a deeper breakdown.
At the same time, the upside is increasingly constrained. Yen weakness near 160 has become a clear policy problem for Japan, and Tokyo has already shown it is willing to push back. Authorities spent 11.7 trillion yen, or roughly $73.5 billion, to support the yen, but the pair remains close to the levels that drew official action in the first place.
That tension is what makes USD/JPY such a tactical market. Near the highs, traders have to respect the risk of another intervention-driven yen rally. On pullbacks, the dollar’s yield advantage can draw carry buyers back in. The result is not a clean one-way trend, but a policy-sensitive range where both sides can still find opportunity.
The June central bank calendar could determine whether that range starts to shift. The Bank of Japan meets June 15–16, followed by the Federal Reserve on June 16–17. If the BOJ hikes while the Fed holds, the yen would have a stronger policy catalyst than intervention alone, potentially giving traders a reason to test the lower end of the recent range around 156.50. If the rate gap remains wide, however, USD/JPY may continue to find buyers on pullbacks.
Japan’s intervention has been forceful, but not decisive
Japan has moved from verbal warnings to direct support for the yen. Recent reports show the Ministry of Finance spent about 11.7 trillion yen, or roughly $73.5 billion, intervening in foreign-exchange markets over the past month to support the currency.
The scale of that effort confirmed what price action had already suggested: Tokyo likely stepped into the market more than once around Japan’s Golden Week holidays, when thinner liquidity may have helped amplify the impact of official yen buying.
The initial move worked. After USD/JPY pushed above 160, the yen strengthened sharply, with the pair falling from above 160 on April 30 all the way down to roughly 156.50. But the effect faded. By late May, USD/JPY had moved back toward the 159 area, where it trades today.
That highlights the limitation of intervention. It can shake out crowded positioning, trigger fast yen rallies and remind traders that 160 is not just another level. But without a shift in the broader macro backdrop, intervention has struggled to change the larger direction of the trade.
The rate gap still favors the dollar. The BOJ has been cautious in normalizing policy, higher energy prices remain a headwind for Japan’s import-heavy economy, and geopolitical uncertainty can keep dollar demand elevated.
That makes intervention more of a ceiling risk than a full reversal signal. A more durable yen move would likely require several pieces to line up together: another credible intervention threat, some easing in geopolitical stress, and a BOJ rate hike while the Fed stays on hold.
Without that combination, intervention risk may keep traders cautious near 160, but it may not be enough on its own to force a sustained breakdown in USD/JPY.
Key levels to monitor in USD/JPY
USD/JPY is currently trading near 159.70, close to the upper end of its recent range and near enough to 160.00 to keep intervention risk firmly in play.
The broader six-month range remains roughly 152.50 to 160.50. That is the main structure of the trade. It has created room for tactical positioning on both sides, while keeping the pair from developing a clean directional break.
With USD/JPY pushing back toward 160.00, the 160.50 area remains a critical red line. A decisive move through that zone would likely put Tokyo’s tolerance to the test, especially after the latest round of intervention produced only a temporary pullback.
On the downside, 159.00 is the first short-term pivot. A move below that level would take USD/JPY out of its tight five-day band and could shift attention back toward 158.00.
The 158.00 area carries more weight. A break below it would suggest the pair is no longer just stalling near the highs, but beginning to rotate lower. Below that, 156.50 marks the lower end of the past month’s range and would move USD/JPY closer to the middle of its broader six-month structure.
The tactical map is straightforward: 160.00-plus is the intervention zone, 158.00 is the first meaningful downside test, and 156.50 would suggest yen strength is extending beyond a short-term pullback. Until one side forces a cleaner break, USD/JPY remains a range-defined, two-way trading opportunity.
Sigmanomics forecasts support a sideways, two-way setup
Sigmanomics data strengthens the current USD/JPY setup because the model is not signaling a decisive break from the range.
Across the 7-day, 14-day and 28-day horizons, the model shows a sideways bias. That mirrors the broader structure: USD/JPY has been volatile, but contained. With the pair trading inside each expected zone, the forecasts support the idea that this remains a two-way market rather than a clean breakout or breakdown.
The 7-day forecast shows an expected zone of roughly 156.27 to 162.64, with USD/JPY recently trading near 159.70. That places the pair inside the model’s range, with the forecast pointing more to range movement than a clear directional break.
The 14-day forecast is similar, with an expected zone of roughly 154.68 to 163.73. The 28-day forecast widens the zone further, to roughly 153.25 to 165.56. Across all three horizons, the message is consistent: USD/JPY has room to move inside the range, but not enough directional agreement to support a clean trend call in either direction.
All told, the Sigmanomics data reinforces the broader market setup. USD/JPY remains a two-way policy trade: intervention risk is elevated near the highs, carry support remains a force on pullbacks, and macro uncertainty continues to create opportunity on both sides of the range.
The bottom line
For USD/JPY traders, this is not a market to ignore simply because it has not broken out. In many ways, the wide swings inside a well-defined range are what make the setup so compelling.
The dollar still has support on pullbacks, especially as yield differentials continue to favor the U.S. side of the pair. But the closer USD/JPY moves toward 160, the more complicated the upside becomes. Japan has already shown a willingness to push back against excessive yen weakness, and every move toward the top of the range now carries the risk of official resistance.
That leaves USD/JPY in a compelling tactical zone.
Near the highs, traders have to account for intervention risk. On pullbacks, they have to respect the yield advantage that continues to support the dollar. And when central bank expectations or geopolitical headlines shift, the pair can move quickly because both sides already have a reason to act.
Until that balance finally breaks, USD/JPY remains one of the more interesting two-way trades in forex: not a clean trend, but a market where timing, levels and policy risk continue to create opportunity.
Author

Sigmanomics
Sigmanomics
Sigmanomics is a financial intelligence platform that delivers expert insights, data-driven analysis, and real-time trading signals across global markets.


