Eco News Boosts Markets
US Dollar: March USD is Up at 96.195.
Energies: April '19 Crude is Down at 59.63.
Financials: The Jun 30 year bond is Up 14 ticks and trading at 147.18.
Indices: The Mar S&P 500 emini ES contract is 48 ticks Lower and trading at 2850.00.
Gold: The April Gold contract is trading Up at 1309.30 Gold is 20 ticks Higher than its close.
Initial Conclusion
This is not a correlated market. The dollar is Up+ and Crude is Down- which is normal and the 30 year Bond is trading Higher. The Financials should always correlate with the US dollar such that if the dollar is lower then bonds should follow and vice-versa. The S&P is Lower and Crude is trading Lower which is not correlated. Gold is trading Higher which is not correlated with the US dollar trading Higher. I tend to believe that Gold has an inverse relationship with the US Dollar as when the US Dollar is down, Gold tends to rise in value and vice-versa. Think of it as a seesaw, when one is up the other should be down. I point this out to you to make you aware that when we don't have a correlated market, it means something is wrong. As traders you need to be aware of this and proceed with your eyes wide open.
At this hour all Asia is trading Higher with the exception of the Indian Sensex which is trading Lower. Currently all of Europe is trading Lower.
Possible Challenges To Traders Today
-
Flash Manufacturing PMI is out at 9:45 AM EST. This is major.
-
Flash Services PMI is out at 9:45 AM EST. This is major.
-
Existing Home Sales is out at 10 AM EST. This is major.
-
Final Wholesale Inventories m/m is out at 10 AM EST. Major.
-
Federal Budget Balance is out at 2 PM EST. This is major.
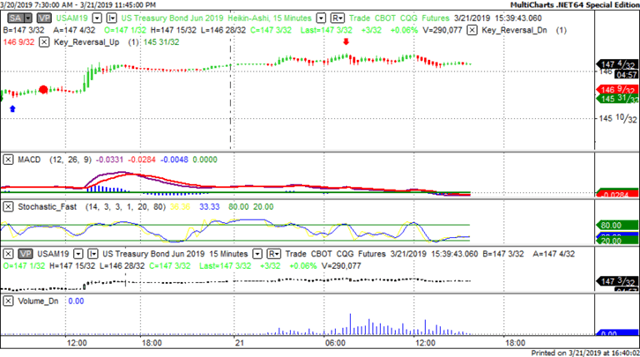
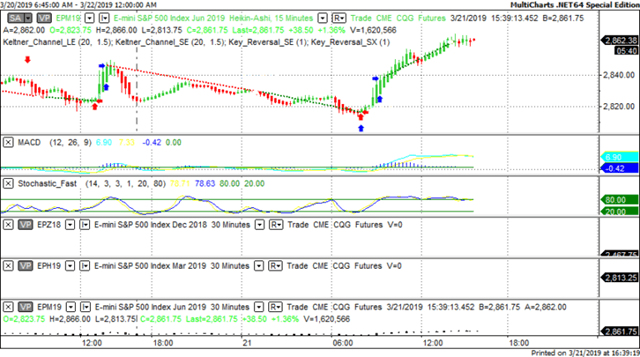
Treasuries
We've elected to switch gears a bit and show correlation between the 30 year bond (ZB) and The YM futures contract. The YM contract is the DJIA and the purpose is to show reverse correlation between the two instruments. Remember it's liken to a seesaw, when up goes up the other should go down and vice versa.
Yesterday the ZB made a major move at around 8 AM EST. The ZB hit a High at around that time and the YM hit a Low. If you look at the charts below ZB gave a signal at around 8 AM EST and the YM was moving Higher at the same time. Look at the charts below and you'll see a pattern for both assets. ZB hit a High at around 8 AM and the YM was moving Higher at the same time. These charts represent the newest version of MultiCharts and I've changed the timeframe to a 15 minute chart to display better. This represented a Shorting opportunity on the 30 year bond, as a trader you could have netted about 15 ticks per contract on this trade. Each tick is worth $31.25. Please note: the front month for the ZB contract is now June, 2019
Charts Courtesy of MultiCharts built on an AMP platform.
Bias
Yesterday we gave the markets a Downside bias as both the USD and the Bonds were trading Higher yesterday morning and this usually reflects a Downside day. The markets had other ideas as the Dow gained 217 points and the other indices gained ground as well. Today we aren't dealing with a correlated market and our bias is Neutral.
Could this change? Of Course. Remember anything can happen in a volatile market.
Commentary
On Wednesday the Federal Reserve showed a dovish stance in relation to interest rates and the markets took that as a sign of potential economic weakness and sold off. Yesterday however the markets received good economic news as it relates to Philly Fed Mfg Index, Unemployment Claims and Leading Index. As such the markets gained momentum and soared higher with the Dow gaining over 200 points. Today we have Existing Home Sales which is a proven market mover.
Author

Nick Mastrandrea
Market Tea Leaves


