Earnings Season Starts

US Dollar: June USD is Down at 96.520.
Energies: May '19 Crude is Down at 63.39.
Financials: The Jun 30 year bond is Down 9 ticks and trading at 146.25.
Indices: The June S&P 500 emini ES contract is 40 ticks Higher and trading at 2919.50.
Gold: The June Gold contract is trading Down at 1287.30 Gold is 40 ticks Lower than its close.
Initial Conclusion
This is not a correlated market. The dollar is Down- and Crude is Down- which is not normal and the 30 year Bond is trading Lower. The Financials should always correlate with the US dollar such that if the dollar is lower then bonds should follow and vice-versa. The S&P is Higher and Crude is trading Lower which is correlated. Gold is trading Lower which is not correlated with the US dollar trading Down. I tend to believe that Gold has an inverse relationship with the US Dollar as when the US Dollar is down, Gold tends to rise in value and vice-versa. Think of it as a seesaw, when one is up the other should be down. I point this out to you to make you aware that when we don't have a correlated market, it means something is wrong. As traders you need to be aware of this and proceed with your eyes wide open.
At this hour all of Asia is trading Higher. Currently all of Europe is trading Higher as well.
Possible Challenges To Traders Today
-
Capacity Utilization Rate is out at 9:15 AM EST. This is major.
-
Industrial Production m/m is out at 9:15 AM EST. This is major.
-
NAHB Housing Market Index is out at 10 AM EST. This is major.
Treasuries
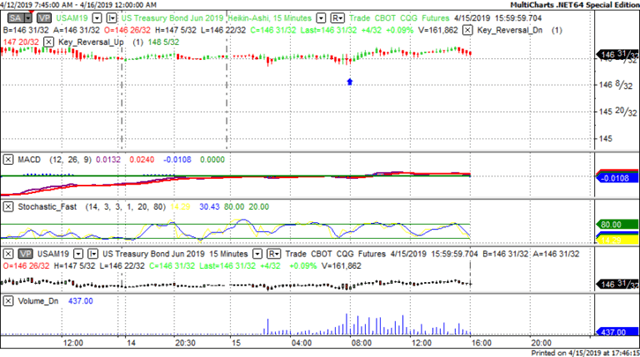
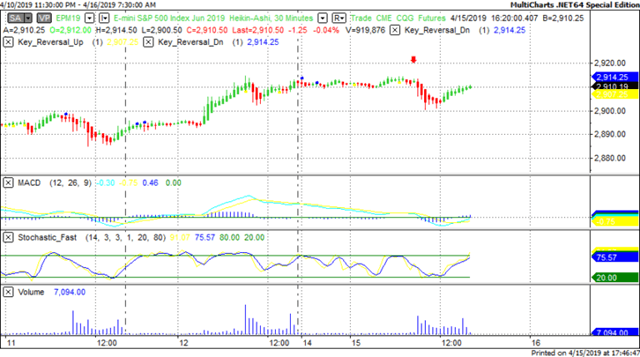
We've elected to switch gears a bit and show correlation between the 30 year bond (ZB) and The YM futures contract. The YM contract is the DJIA and the purpose is to show reverse correlation between the two instruments. Remember it's liken to a seesaw, when up goes up the other should go down and vice versa.
Yesterday the ZB made a major move at around 8 AM EST. The ZB hit a Low at around that time and the YM hit a High. If you look at the charts below ZB gave a signal at around 8 AM EST and the YM was moving Lower at the same time. Look at the charts below and you'll see a pattern for both assets. ZB hit a Low at around 8 AM and the YM was moving Lower at the same time. These charts represent the newest version of MultiCharts and I've changed the timeframe to a 15 minute chart to display better. This represented a Long opportunity on the 30 year bond, as a trader you could have netted about a dozen ticks per contract on this trade. Each tick is worth $31.25. Please note: the front month for the ZB contract is now June, 2019
Charts Courtesy of MultiCharts built on an AMP platform.
Bias
Yesterday we gave the markets an Upside bias however the markets had other ideas as the Dow dropped 28 points and the other indices lost ground as well. Today we aren't dealing with a correlated market and our bias is to the Upside.
Could this change? Of Course. Remember anything can happen in a volatile market.
Commentary
Initially we saw the prospect of an upside day yesterday. This was because both the USD and the bonds were trading Lower yesterday morning. However this changed as the morning wore on and as we say each and every day "this too can change". Earnings season has officially kicked off and already the analysts and pundits are clamoring to determine what kind of an earnings season it will be. From our perspective we take one day at a time and use our market correlation rules to determine overall direction.
Author

Nick Mastrandrea
Market Tea Leaves


