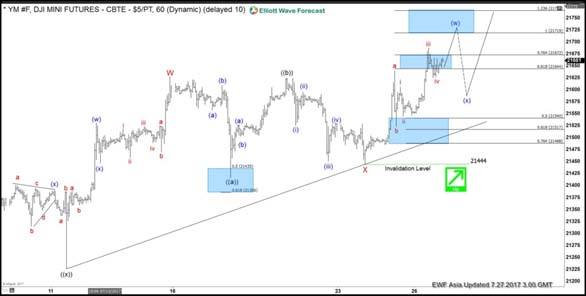
Short term YM_F (Dow E-Mini Future)ElliottWave view suggests the rally from 6/29 low is unfolding as a double three Elliott wave structure and ended with Minor wave W at 21628. Down from there, Minor wave X pullback unfolded as a running Elliott Wave flat. Minute wave ((a)) ended at 21457, Minute wave ((b)) ended at 21624, and Minute wave ((c)) of X ended at 21444. Index has since made a new high suggesting the next leg higher has started. Up from 21444 low, Sub Minutte wave a ended at 21640. And Sub Minutte wave b pullback ended at 21524, while above there expect Index to extend higher again.

Near term focus remains towards 21719-21769 100%-123.6% extension area from 21444 low to end the Minutte wave (w) higher. The index then has scope to see a pullback, which should then find buyer’s again in sequence of 3, 7 or 11 swings for further upside provided the pivot at 21444 low remains intact. We don’t like selling the Index and favors buying the dips against 21444 low in the first degree.

Dow E-Mini Future 1 Hour Elliott Wave View

Chart

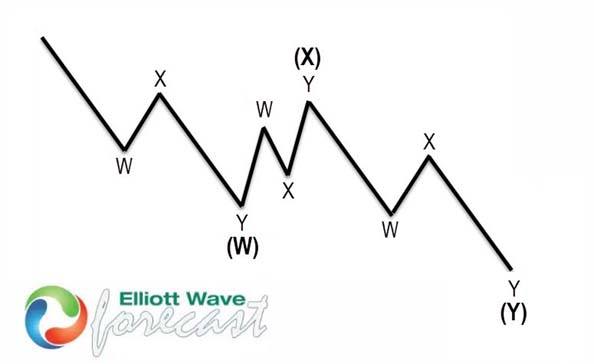
7 swings structure is one of the most common patterns in the theory of New Elliott Wave & it is also mainly know as double three Elliott Wave pattern. Market find that very often nowadays in many instruments in almost all time frames. It is a very reliable structure by which we can make a good analysis and what is more important is giving us good business inputs with clearly defined levels invalidation and destination areas.

The image below shows what Elliott wave pattern Double Three looks like. It has (W), (X), (Y) and 3,3,3 internal structure, which means that all these 3 legs are corrective sequences. Each (W), (X) and (Y) are made of three waves, which are having the structure W, X, Y in lesser degree as well. Elliott Wave principle is a form of technical analysis that traders use to analyze the cycles of financial markets and market trends forecast by identifying extremes in investor psychology, high and low prices, and other collective factors. Important to Note that 3 waves could also be labeled ABC (5-3-5) structure as well. How are labeled 3 waves it depends on the internal price structure subdivisions waves i.e. whether the price action is corrective or motive.

Chart

Chart


Become a Successful Trader and Master Elliott Wave like a Pro. Start your Free 14 Day Trial at - Elliott Wave Forecast.

FURTHER DISCLOSURES AND DISCLAIMER CONCERNING RISK, RESPONSIBILITY AND LIABILITY Trading in the Foreign Exchange market is a challenging opportunity where above average returns are available for educated and experienced investors who are willing to take above average risk. However, before deciding to participate in Foreign Exchange (FX) trading, you should carefully consider your investment objectives, level of xperience and risk appetite. Do not invest or trade capital you cannot afford to lose. EME PROCESSING AND CONSULTING, LLC, THEIR REPRESENTATIVES, AND ANYONE WORKING FOR OR WITHIN WWW.ELLIOTTWAVE- FORECAST.COM is not responsible for any loss from any form of distributed advice, signal, analysis, or content. Again, we fully DISCLOSE to the Subscriber base that the Service as a whole, the individual Parties, Representatives, or owners shall not be liable to any and all Subscribers for any losses or damages as a result of any action taken by the Subscriber from any trade idea or signal posted on the website(s) distributed through any form of social-media, email, the website, and/or any other electronic, written, verbal, or future form of communication . All analysis, trading signals, trading recommendations, all charts, communicated interpretations of the wave counts, and all content from any media form produced by www.Elliottwave-forecast.com and/or the Representatives are solely the opinions and best efforts of the respective author(s). In general Forex instruments are highly leveraged, and traders can lose some or all of their initial margin funds. All content provided by www.Elliottwave-forecast.com is expressed in good faith and is intended to help Subscribers succeed in the marketplace, but it is never guaranteed. There is no “holy grail” to trading or forecasting the market and we are wrong sometimes like everyone else. Please understand and accept the risk involved when making any trading and/or investment decision. UNDERSTAND that all the content we provide is protected through copyright of EME PROCESSING AND CONSULTING, LLC. It is illegal to disseminate in any form of communication any part or all of our proprietary information without specific authorization. UNDERSTAND that you also agree to not allow persons that are not PAID SUBSCRIBERS to view any of the content not released publicly. IF YOU ARE FOUND TO BE IN VIOLATION OF THESE RESTRICTIONS you or your firm (as the Subscriber) will be charged fully with no discount for one year subscription to our Premium Plus Plan at $1,799.88 for EACH person or firm who received any of our content illegally through the respected intermediary’s (Subscriber in violation of terms) channel(s) of communication.

Recommended Content


Recommended Content

Editors’ Picks

AUD/USD posts gain, yet dive below 0.6500 amid Aussie CPI, ahead of US GDP

AUD/USD posts gain, yet dive below 0.6500 amid Aussie CPI, ahead of US GDP

The Aussie Dollar finished Wednesday’s session with decent gains of 0.15% against the US Dollar, yet it retreated from weekly highs of 0.6529, which it hit after a hotter-than-expected inflation report. As the Asian session begins, the AUD/USD trades around 0.6495.

AUD/USD News

USD/JPY finds its highest bids since 1990, approaches 156.00

USD/JPY finds its highest bids since 1990, approaches 156.00

USD/JPY broke into its highest chart territory since June of 1990 on Wednesday, peaking near 155.40 for the first time in 34 years as the Japanese Yen continues to tumble across the broad FX market. 

USD/JPY News

Gold stays firm amid higher US yields as traders await US GDP data

Gold stays firm amid higher US yields as traders await US GDP data

Gold recovers from recent losses, buoyed by market interest despite a stronger US Dollar and higher US Treasury yields. De-escalation of Middle East tensions contributed to increased market stability, denting the appetite for Gold buying.

Gold News

Ethereum suffers slight pullback, Hong Kong spot ETH ETFs to begin trading on April 30

Ethereum suffers slight pullback, Hong Kong spot ETH ETFs to begin trading on April 30

Ethereum suffered a brief decline on Wednesday afternoon despite increased accumulation from whales. This follows Ethereum restaking protocol Renzo restaked ETH crashing from its 1:1 peg with ETH and increased activities surrounding spot Ethereum ETFs.

Read more

Dow Jones Industrial Average hesitates on Wednesday as markets wait for key US data

Dow Jones Industrial Average hesitates on Wednesday as markets wait for key US data

The DJIA stumbled on Wednesday, falling from recent highs near 38,550.00 as investors ease off of Tuesday’s risk appetite. The index recovered as US data continues to vex financial markets that remain overwhelmingly focused on rate cuts from the US Fed.

Read more

Majors

Cryptocurrencies

Signatures