Don’t Fight The Fed
The stock market continued its trend of not doing much on Tuesday as the S&P 500 eked out a 0.06% gain. The main political story in the news is the Senate’s vote on whether to approve Judge Gorsuch’s nomination to the Supreme Court, so there’s not much market moving stories coming out of Washington D.C. for a change. Even monetary policy news is not market moving as the Richmond Fed president stepping down over leaking Fed policy in 2012 also won’t affect traders’ decisions. It’s certainly disheartening for smaller investors to see professional money managers getting an inside scoop about what monetary policy will be pursued.
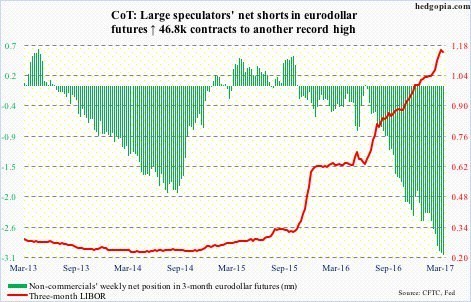
With no major news events until the Wednesday ADP report and the meeting between President Trump and Chinese President Xi Jinping on Thursday and Friday, in this article I will discuss the bubble the market is in from a few steps back. Through most of this bull market bulls argued that you can’t fight the Fed. They were proven correct during the rally, but to be consistent they should no longer be buying stocks since the Fed isn’t on their side now. As you can see in the chart below. This bubble rally has been longer and stronger because interest rates were kept lower for longer. After these next few planned rate hikes, stocks will fall again if the precedent started in the last two cycles holds.

The increase in the three-month Libor and the increase in shorts of Eurodollar futures are signaling the potential for rate hikes. The past two cycles were able to take many more rate hikes than the market/economy will be able to take this time because the debt level is higher and the economy is weaker than the last two bubbles.
The chart below shows the bubble in its full glory. It shows the Wilshire 5000’s market cap as a percent of GDP. The size of the bubble is about 10% smaller than the tech bubble. Personally, I wouldn’t want to be around to see if it can eke out a few more percentage points to reach a new record. On a per company basis, the stock market is way more expensive than during the tech bubble because the number of firms in the Wilshire 5000 has fallen by over half. On July 31st, 1998, there were 7,562 companies in the index. At the end of last year, there were only 3,618 firms in the index. This means the average firm in the index is about double the size as a percent of GDP compared to the tech bubble. The 1990s tech bubble was highly concentrated in one sector, but this one is more broad based.

Even though the bubble is more vulnerable to popping than ever before, inverse ETFs have less than half the market share as compared to 2010. The inverse ETF market share is a great inverse indicator for investors as bears being on the endangered species list shows the bull market is near its apex. This bubble has been easier to spot than the last two because of the recent history of market crashes. This has made investors more skeptical especially at the beginning of this bull market as you can see in the inverse ETF market share. Bull markets are born on skepticism and killed by complacency.

The question which has been on every bear’s mind since as long as they’ve been bearish is when the shoe will drop. There is no way to predict when the bubble will burst. The only thing we can do is follow the bread crumb trails and prepare for when the inevitable occurs. The first bread crumb which I mentioned, is the Fed raising rates. The second bread crumb is shown below. As you can see, the six-month credit flow in the U.S., Europe, and China is decelerating. In America, the credit flow is the weakest since 2011 which should give optimists pause when deciding whether to take more risk. The chart shows how the Chinese burst of credit growth in 2009 dragged the economy out of the depths of the recession.

The third bread crumb is shown in the chart below. As you can see, the unemployment rate forecasts future GDP growth accurately. The unemployment rate has a high correlation to the subsequent 4 year average GDP growth rate. The current low level of unemployment suggests the next 4 years will have weak GDP growth. With the economy expected to grow 1.2% in Q1 according to the Atlanta Fed, any negative catalyst can put it in a deep recession.

The last chart I will leave you with in this article is the 14-year historical breakdown of loans by delinquency status. The amount of loans which are current is very close to the peak in late 2005. No wonder the consumer sentiment is so high. It’s very disconcerting that even with the high percentage of consumer debt being current, the banks are starting to pull back on their lending and tighten their standards. The banks must see economic weakness ahead. They are not blinded by the potential reforms of the current administration even though they may be the biggest winners in the deregulatory effort as Dodd-Frank’s toughest measures are about to be rolled back.

Conclusion
Bullish investors should follow the same advice which led them to ride the wave of this bull market. They didn’t fight the Fed when it had interest rates low, and now they shouldn’t fight the Fed during its hiking spree. At this point, separating investors into bullish and bearish categories is nearly obsolete as almost all investors are bullish. As I showed, the inverse ETFs have nearly died out. Their time will come again shortly. When these ETFs start to gain traction, it will start to make sense to be buying stocks.
The timing of this cycle has been tough because of the extraordinary actions taken by global central banks. The best tea leaves I can provide as to when the party will end is the chart which slows credit flow. The fact that bank loan growth is slowing when the labor market is very strong and the consumer is mainly current on its loans may be a warning sign that the bubble may be getting ready to pop.
Don Kaufman: Trade small and Live to trade another day at Theotrade.
Don Kaufman: Trade small and Live to trade another day at Theotrade.
Author

TheoTrade Analysis Team
TheoTrade, LLC
Don Kaufman, Co-Founder, Chief Derivatives Instructor (Trader Stocks, Options, Futures) Don is one of the industry's leading financial strategists and educational authorities.


