Dollar bounces with yield lower, but can it last?

Market Overview
Whilst focus has been on moves on the yen for much of this week, the dollar has been hit with some significant volatility in the past 24 hours. Reports out of China suggest that officials are recommending scaling back or even halting purchases of US Treasuries amid concerns over the two countries’ trade relations and also the debt supply. This spiked Treasury yields higher and saw the dollar in a tail spin. There has been a recovery of sorts this morning, as US yields have pulled lower from yesterday’s 2.59% high back towards 2.53% today, and the dollar bulls have regathered themselves, but the legacy of downside dollar pressure remains. If the reports are true, then this could have wide reaching consequences. Over a third of China’s foreign exchange reserves of $3.1trillion are held in US Treasuries (c. $1.2trillion) and if this begins to be diversified into assets of other currencies (such as euro or yen) then the dollar will come under further strain. Market sentiment also hit a wobble on the back of this as Treasury yields spiking higher sends shockwaves through markets and safe haven plays tend to benefit (here we see yen and gold). The moves this morning have settled a touch as suggestions have been that this news may not have been entirely accurate. However with concerns over the US potentially preparing to withdraw from NAFTA, protectionism is back on the agenda, something that again could kick up a storm amidst these overly sanguine trading conditions.

Wall Street close only marginally weaker in the end with the S&P 500 -0.1% at 2748 whilst Asian markets have been mixed overnight (Nikkei -0.1%) and the European markets are consolidating in early moves. In forex, the dollar is looking to claw back some of yesterday’s losses against the yen, whilst the Aussie is outperforming after Australian retail sales beat estimates. In commodities, we see gold consolidating after a choppy day yesterday, whilst oil is also consolidating as the move to new three year highs continued yesterday.
US inflation begins to be the theme of the backend of the week and today it is the turn of the US factory gate inflation. However, the ECB monetary policy meeting accounts will be the first focus for markets at 1230GMT. The rhetoric from the more hawkish Governing Council members is ratcheting up now and it will be interesting to see how the improvement in the economic outlook is taken in the minutes. US PPI is at 1330GMT and is expected to show headline PPI dip slightly to +3.0% (from +3.1% YoY) whilst the core PPI is expected to tick mildly higher to +2.5% (from +2.4% last month). The weekly jobless claims at 1330GMT are expected to improve slightly to 245,000 (from 250,000 last week).
Chart of the Day – DAX Xetra
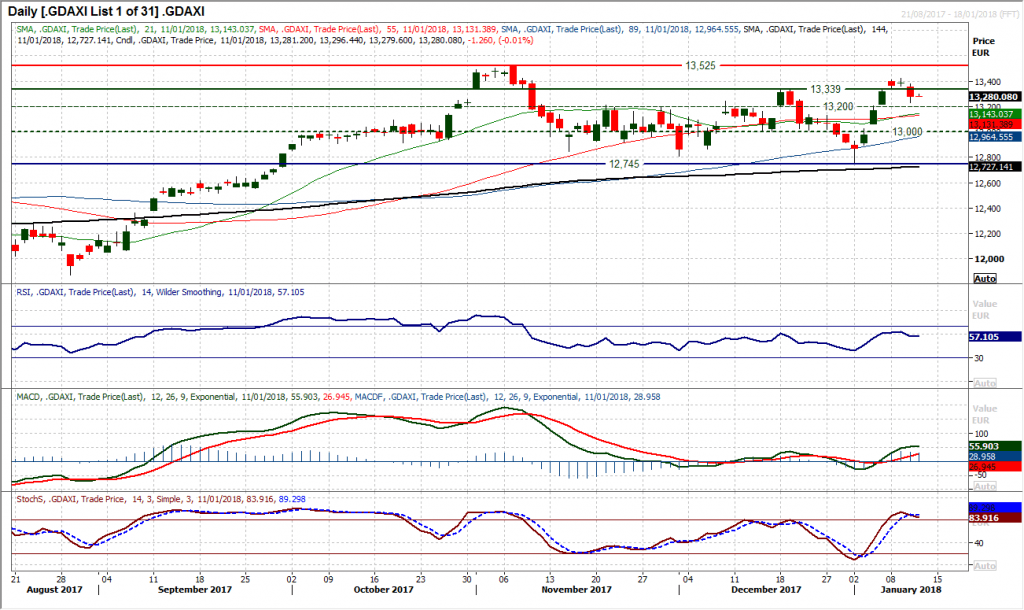
Ever since the market broke through the key old high at 13,339 earlier in the week, the question has been whether this move could be held if market sentiment had a wobble. Despite posting gains on Monday and Tuesday, the candlesticks over those sessions as a whole were a concern and now the market has decisively closed below the support of the 13,339 breakout. For a market with form when it comes to retracements and false breaks, this is a concern for the bulls. This now increases the likelihood of a corrective move to the downside once more. With yesterday’s negative candle, momentum indicators are quickly turning lower again with the RSI back under 60 and the Stochastics crossing back lower. The old breakout of the December high which had been supportive earlier this week now becomes a near term basis of resistance. The reaction of the market today could now be key, as a failure to recover back above 13,339 would be a worry for the bulls, especially with the prospect of a lower high forming.
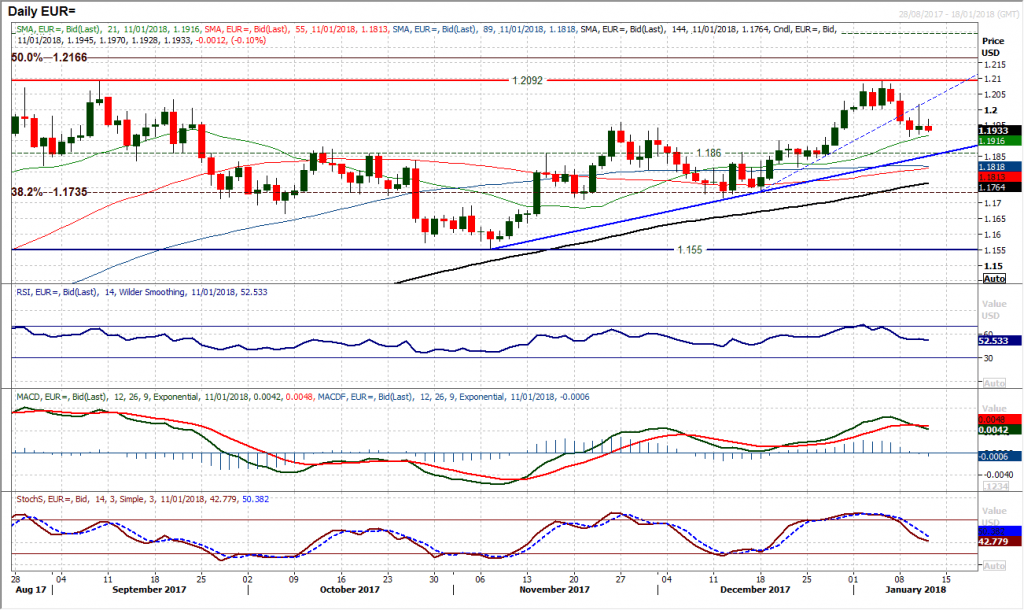
It was a volatile session yesterday as markets reacted to the news that China may be ready to step back from buying US Treasuries. The initial dollar weakness saw the dollar sold sharply and EUR/USD spiked higher. However a subsequent unwinding of the move has left a highly uncertain looking candle. A small positive move on the day but with a long upper shadow reflects a bull failure, which has left resistance around $1.2015. However whilst the support of Tuesday’s low at $1.1915 remains intact then the bulls will be able to build confidence again. There is a somewhat mixed look to momentum outlook as the corrective slide on RSI and Stochastics begins to subside, however the MACD lines are beginning to fall back. The early move today suggests a consolidation in the market as participants look to assess the situation again after a yesterday’s volatility. A breach of $1.1915 to the downside or $1.2015 to the upside is likely to provide direction near term. Subsequent support is around $1.1860 with the key resistance at $1.2092.
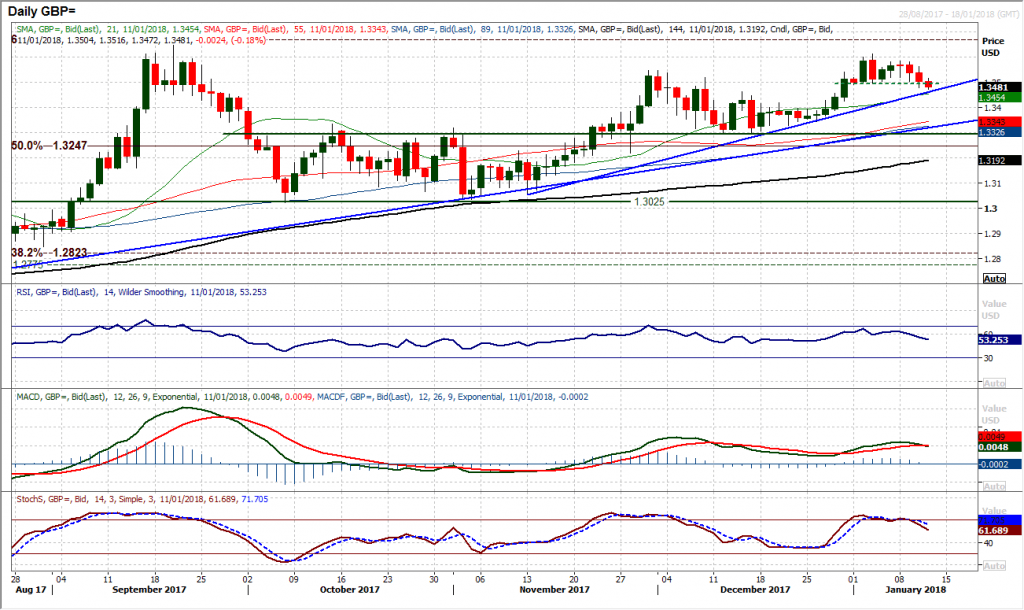
Before the spike higher on the back of news over China’s views on US Treasuries broke, the US dollar bulls were beginning to regain the initiative. The spike higher has failed around $1.3560 and again the market has retreated back below the support around $1.3500. With the market again testing yesterday’s low around $1.3480 this morning it looks as though the corrective slide is resuming once more. The big question is whether the market can hold on to the nine week uptrend on the daily chart which today comes in around $1.3460. The near term correction is holding, as the daily MACD lines cross lower and Stochastics also begin to slip back. This current move still has the look of a correction within a medium term bull market as the momentum indicators remain positively configured on a medium term basis. There is also a clutch of support between $1.3420/$1.3460 that will be seen as a chance to buy if the Cable bulls can begin to build again. For now though with intraday resistance $1.3515/$1.3560 the minor rallies are being sold into.
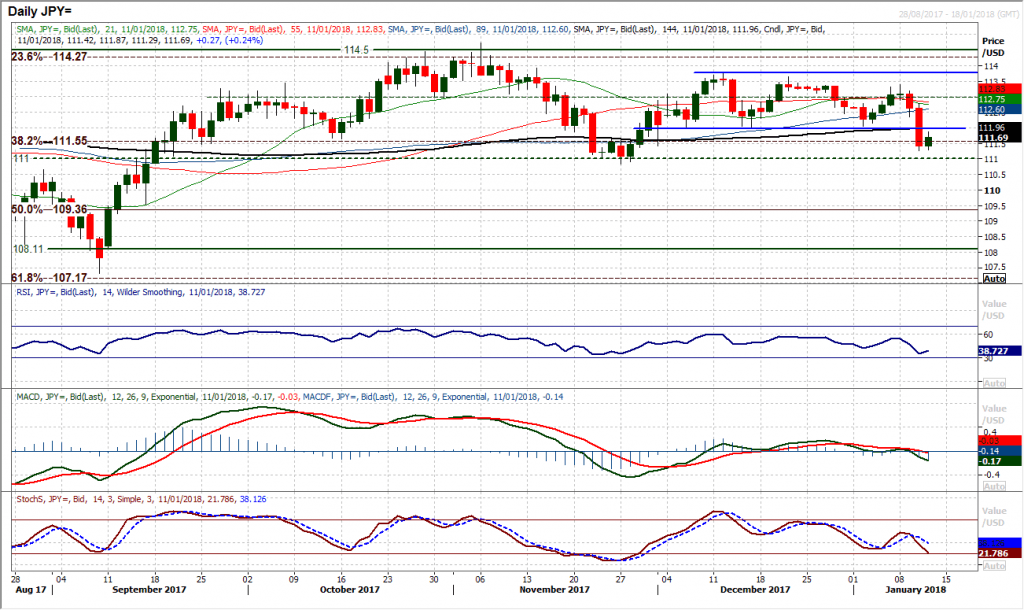
The burgeoning yen strength and yesterday’s dollar weakness combined to make a significantly strong bear candle on Dollar/Yen. The move sold off 120 pips on the day to breach the five week support of 112.00. How the dollar bulls now react to this breakdown will be key for the outlook. Rallies are a chance to sell with the previous support now becoming a basis of resistance at 112.00. The hourly chart shows a band of resistance 112.00/112.40 as a mini-sell zone now. The initial reaction has been positive this morning but just how far can the bulls take this before the selling pressure resumes again? Pressure on the key November low at 110.85 will resume unless the dollar bulls can re-group quickly.
Gold
Aside from the intraday spike higher yesterday that took gold to a new four month high, essentially the yellow metal has been in a sideways consolidation now for the past week. Holding above support at $1305.60, the price action has threatened the support of a four week uptrend yesterday, only for the sharp move higher intraday to save it from a closing breach. However this is a warning for the bulls and with the uptrend today at $1316 (in the midst of the recent consolidation range) it seems likely that the trend will be broken at some stage soon. This is unless the buyers can pull strongly higher imminently. Ultimately what counts is that the support is held above the long term pivot band $1300/$1310 and with the moving averages all turning up the medium term outlook is ever improving. Yesterday saw yet another intraday dip into $1300/$1310 bought into and even if the uptrend is breached, near term dips continue to be bought into.

WTI Oil
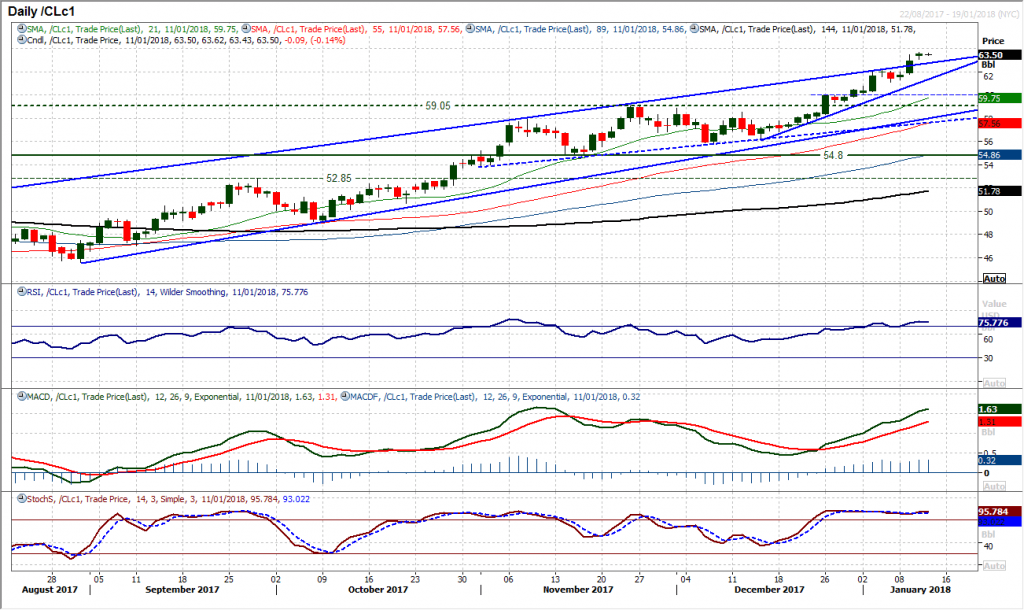
Given the API inventories on Tuesday, the slightly higher than expected drawdown in EIA crude oil stocks came as little surprise and the price has shown minimal reaction. The market subsequently spent much of the session consolidating the breakout to a new three year high. Momentum is strong but looking a touch stretched, however that does not seem to be deterring the bulls for now. However the candlestick formed yesterday was a small bodied move suggesting a degree of indecision which could potentially induce a pullback of some description. The uptrend of the past four weeks comes in at $61.40 today with a band of support $61.10/$62.00 seen as a near term buy zone on support. There is little real resistance from December 2014 until the $69.50/$70 area.
Dow Jones Industrial Average
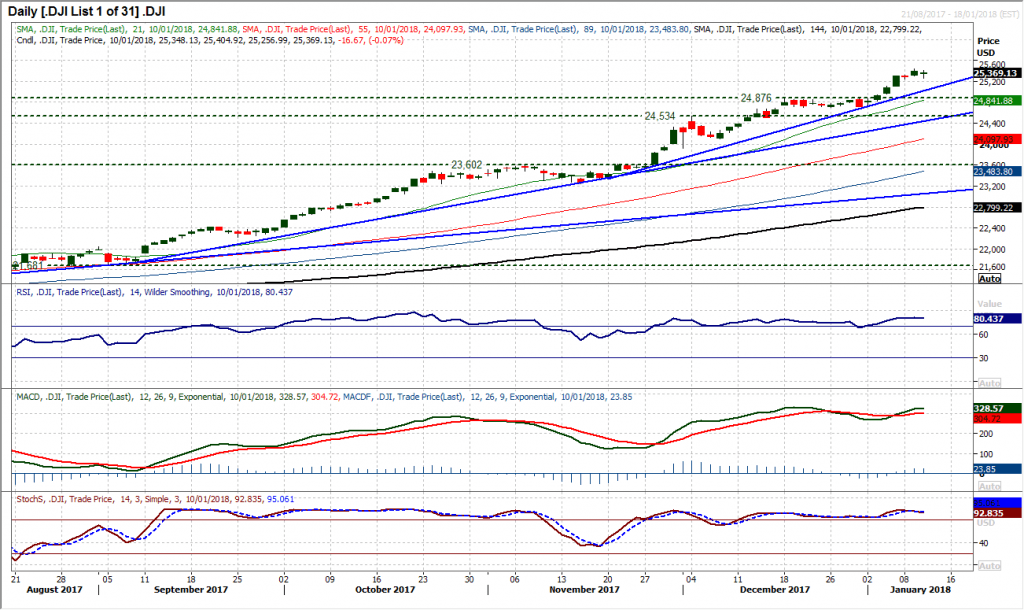
With market sentiment taking a bit of a hit yesterday, Wall Street equities have just dipped back a touch. So far this is nothing to be overly concerned about (with the Do actually positing a marginally positive session, closing above the initial open lower) with the uptrend of the past seven weeks coming in as support at 25,065. Momentum indicators have ticked mildly lower in response to the negative day but still remain bullishly configured to suggest that this is still likely to be a brief correction that provides another chance to buy the uptrend. Although the hourly chart shows momentum rolling over, the initial support around 25,237 remains intact and the market continues to support into weakness. The all-time high at 25,440 is the initial resistance now.
Author

Richard Perry
Independent Analyst


