Dollar begins to form support as Treasury yields pick up again

Market Overview
There was little real reason behind yesterday’s sharp dollar correction. Factor’s such as Trump’s burgeoning chaotic approach to his Presidency and European political risk have been cited as factors, but, in the absence of a real catalyst, it looks as though it has simply been profit taking that has beset the dollar and for that reason it is unlikely to be too long before the dollar find support once more. The US data has been strong this week and continues to reflect an economic improvement that the FOMC will be required to take notice of. Expectations of a rate hike have moved higher and despite the drop in Treasury yields yesterday, there are signs that a low may be about to form once more. This should be supportive for the dollar again. Key charts such as Dollar/Yen, Euro/Dollar and Gold have all moved against the Greenback but there has been no decisive dollar sell signal. What is more likely is that this is a brief consolidation move which needs to settle before the dollar recovery will continue. Already today, the dollar has started to find a degree of support again, although perhaps we will need to wait to next week for the real support as there is little US data to help drive the dollar today.

Wall Street stalled its rally last night with the S&P 500 -0.1% at 2347 whilst Asian markets were also mildly weaker with the Nikkei -0.6% on the stronger yen. European markets are set to continue this consolidation theme with a mixed to slightly higher open today. Forex markets are showing mild dollar strength with no significant movers, whilst the gold price is slightly lower amid the dolalr strength. Oil is once more consolidating.
There is a light economic calendar for traders today, however there will be a focus on the UK Retail Sales at 0930GMT which will give further insight into the reaction of the UK consumer as inflation has started to bite recently. The expectation is that Year on Year ex-fuel retail sales will drop back to 3.9% (from 4.9%). Having previously found the benefit of sterling weakness, this is beginning to swing round as input prices have increased in recent months and prices have started to be hiked in response. Will this start to impact on retail sales?
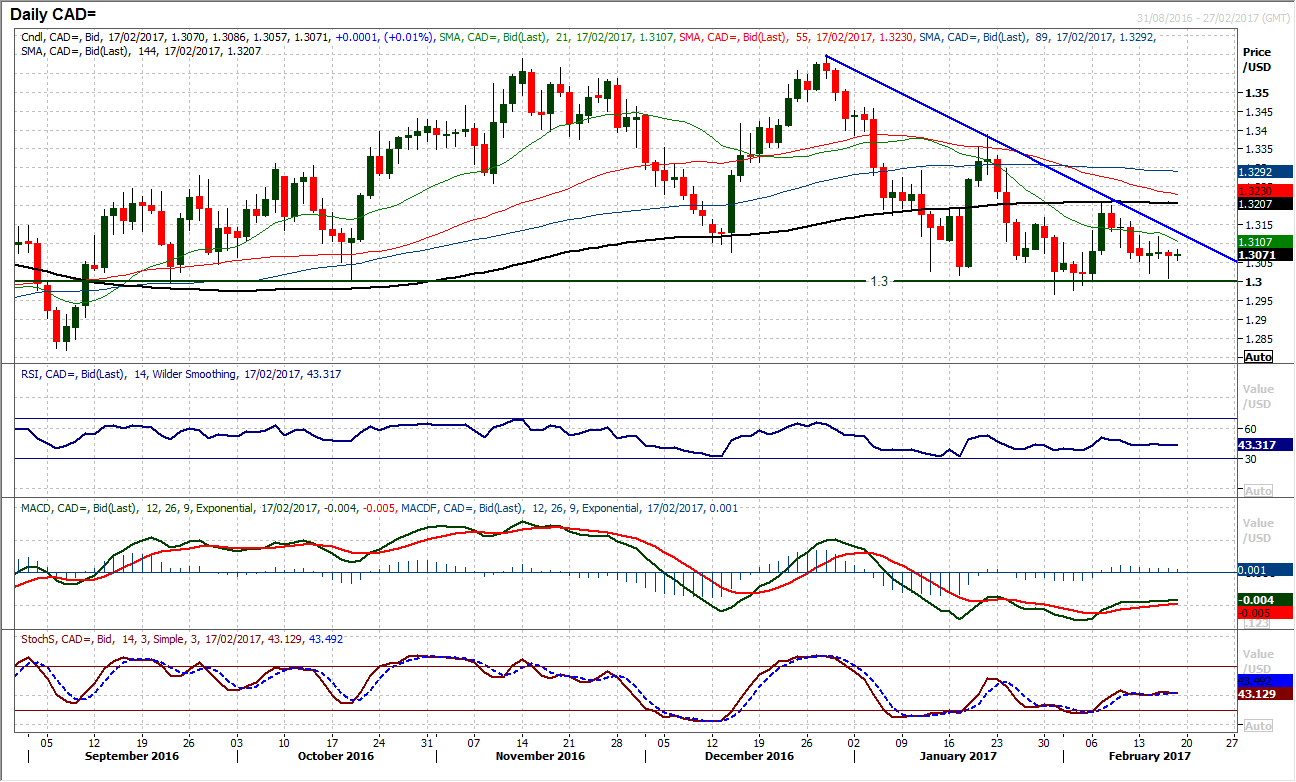
Chart of the Day – USD/CAD
The profit taking on the dollar returned yesterday and looked to drag the pair back to 1.3000 once more, however this is a considerable level of support which remains largely intact and it seems that buyers are happy to continue to defend this level. The flat oil price is helping to prevent the downside on USD/CAD (CAD strengthens on stronger oil), and the technical rally into the close has left a candle that is almost looking like a bull hammer. The uncertainty with the decline has increased in recent days, with a string of (almost) doji candles which have had three closing prices all within 7 pips. The downtrend of the past 7 weeks is intact however the uncertainty is mounting. The momentum indicators are somewhat neutrally configured on the daily chart with a mild bear bias (not unexpected in light of the pressure on the support) , however it is interesting to see the hourly momentum indicators starting to improve again as the market pulled higher from 1.3007 whilst there was also a bullish engulfing candle on the hourly chart (bullish key one hour reversal). The key near term resistance at 1.3120 needs to be breached to improve the outlook as it would signal a bullish recovery really has legs. A close below 1.3000 would be the key bear move.
EUR/USD
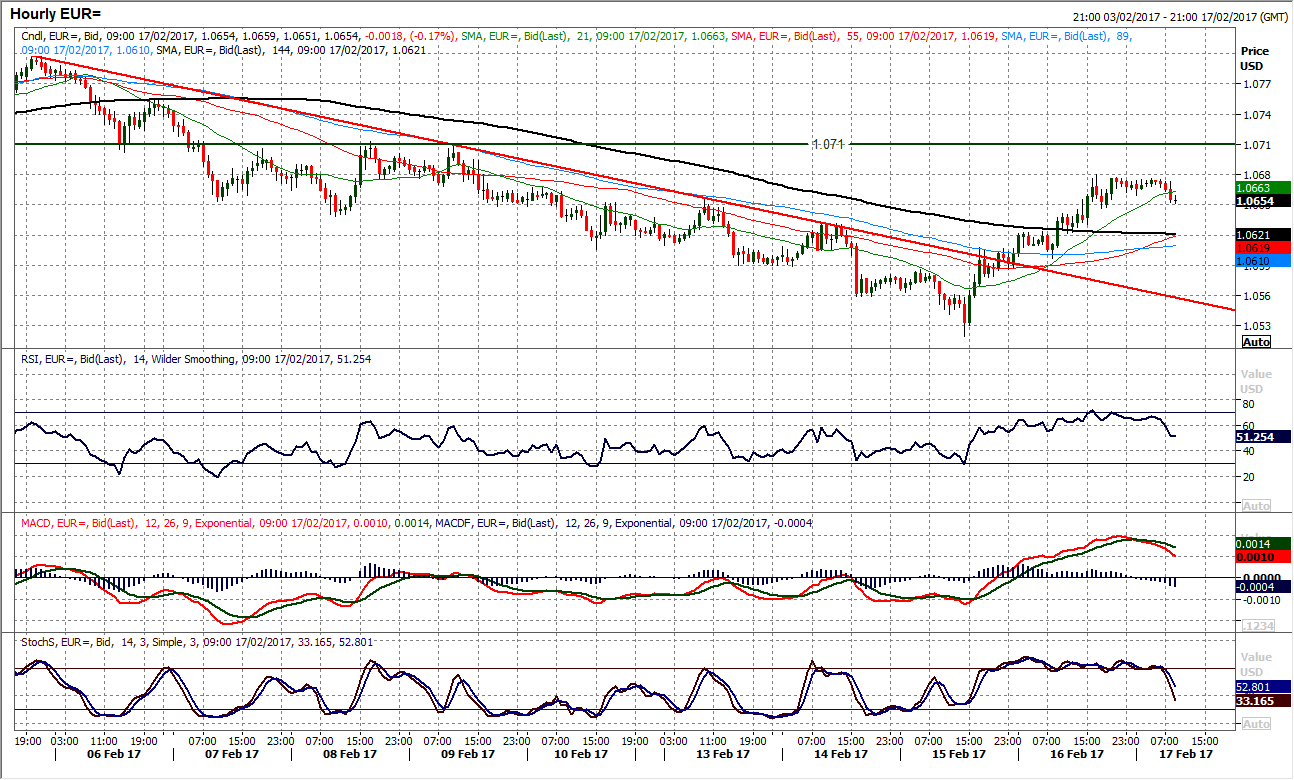
There has been a dramatic move against the dollar in the last couple of sessions and this has shown itself through in a strong rally on EUR/USD. This rally has seen a rebound of 160 pips to yesterday’s peak and has decisively broken the near term trend lower that had been forming over the past couple of weeks. The momentum indicators have ticked higher with the near term crossover buy signal on the Stochastics the main improvement signal. The hourly chart shows the recovery but it will be interesting to see if the bulls can sustain a move higher. The medium term outlook would point towards selling into strength whilst the key near term pivot at $1.0710 remains intact as a basis of resistance for now. The hourly momentum indicators are worth watching now as the hourly MACD lines have just crossed lower overnight as the rally has just stalled briefly. Will this stalling continue into the European session? A minor pivot around $1.0650 is supportive with $1.0630 and $1.0590 too.
GBP/USD
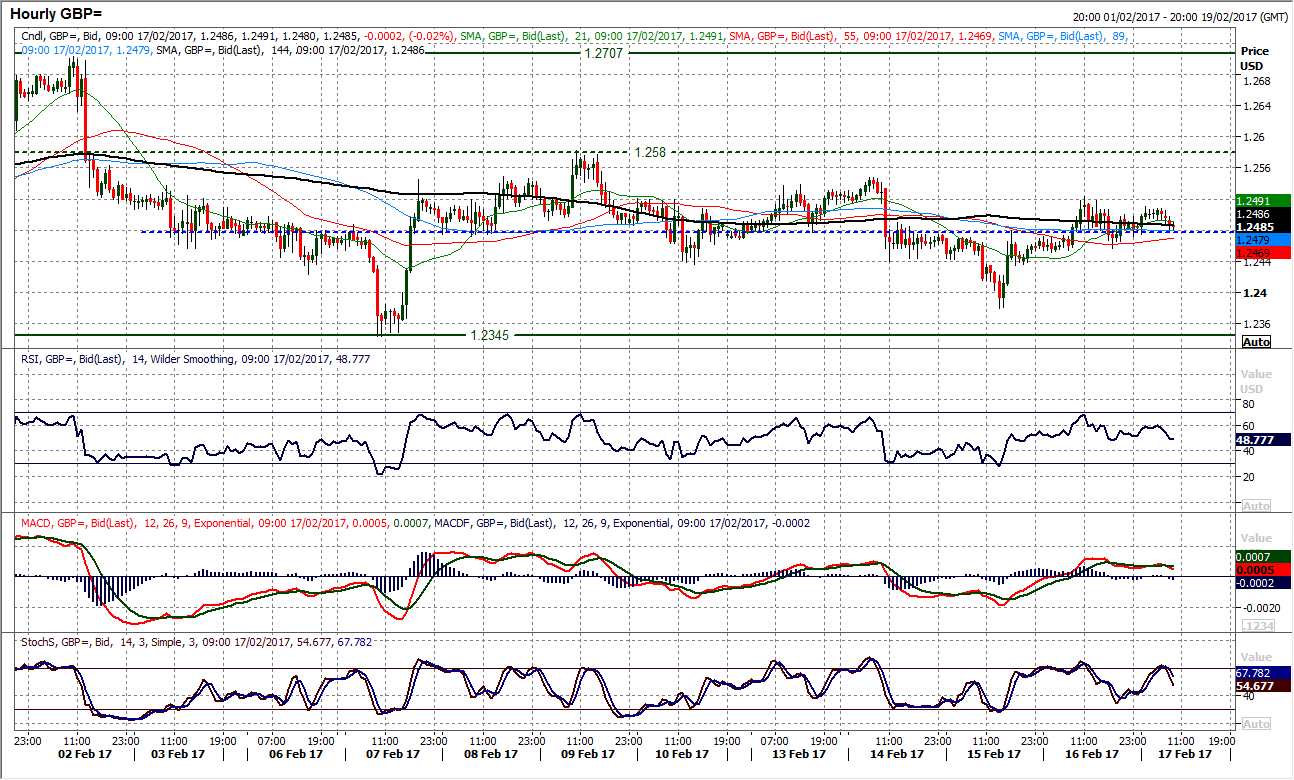
The daily chart shows the lack of decisive direction continues. A mild bid up on Cable has maintained the pivot support around $1.2430 and formed a minor bullish candle yesterday which has been maintained today. However the momentum indicators are showing almost no sign of impetus and the market is in need of a catalyst. This is reflected in the hourly chart shows continues to find resistance at lower levels, with the previous key resistance at $1.2550 adding to overhead pressure. The hourly momentum is oscillating in a ranging configuration now with the hourly RSI between 30 and 70. The sequence of lower highs and consistent pressure back towards $1.2430 suggests that rallies are a chance to sell. There is further resistance at $1.2580 with $1.2600 an old pivot.
USD/JPY
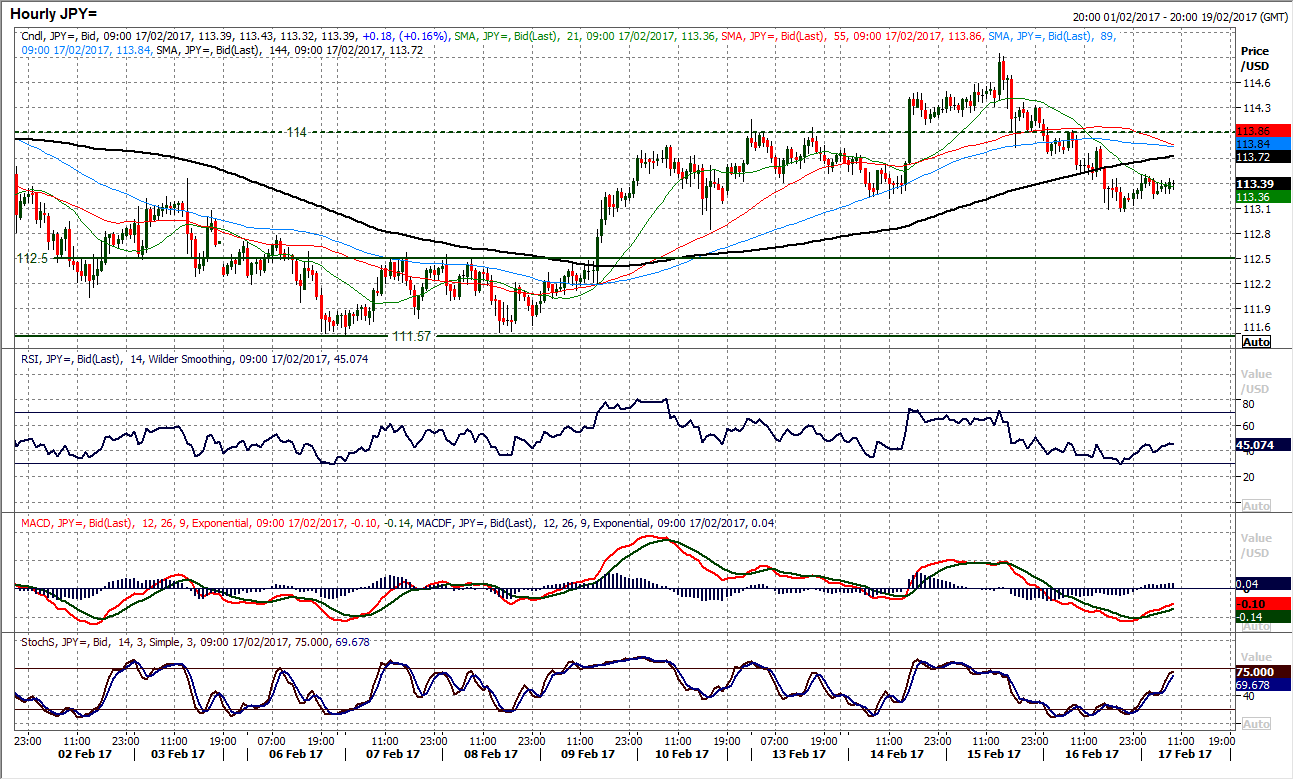
The bulls have lost control of the recovery. The posting of a strong bearish candle which dragged the market 95 pips lower has changed the complexion of this rebound. The momentum indicators are rolling over and there is a far more neutral look to the chart developing. Breaking back below Tuesday’s low at 113.20 was an important near term deterioration and now places added importance on holding above the breakout support at 112.50. The hourly chart has broken 113.20 and is now open for 112.85, whilst the hourly momentum indicators are now longer bullishly configured. This chart has now become increasingly uncertain and neutrally configured and the pivot at 114.00 is once more a key level of near term resistance to watch. A sequence of lower highs over the past couple of days adds to the near term corrective pressure.
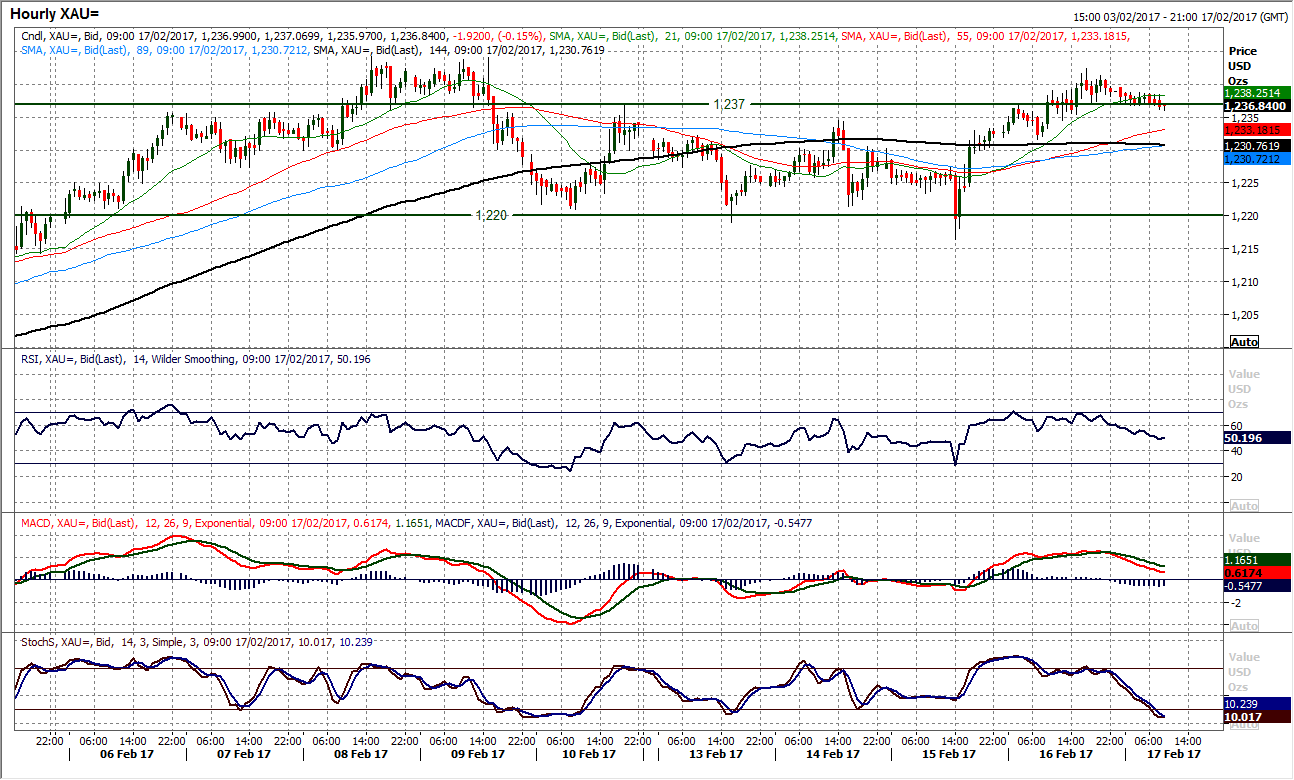
Gold
The outlook for gold has improved as a run of three positive candles has taken the market away from the support at $1220 and back towards a test of $1244 again. The daily momentum indicators are still positively configured with RSI supported abvoe60, and the Stochastics holding well above 80. However the hourly chart shows that the market is probably more of a range play for now and this rally to yesterday’s peak of $1242.30. The hourly momentum is failing to reflect any significant trend direction. There is a band of historic overhead supply between $1241/$1251 which needs to be remembered too. A move back below yesterday’s low at $1231.70 re-opens the downside back towards $1220.
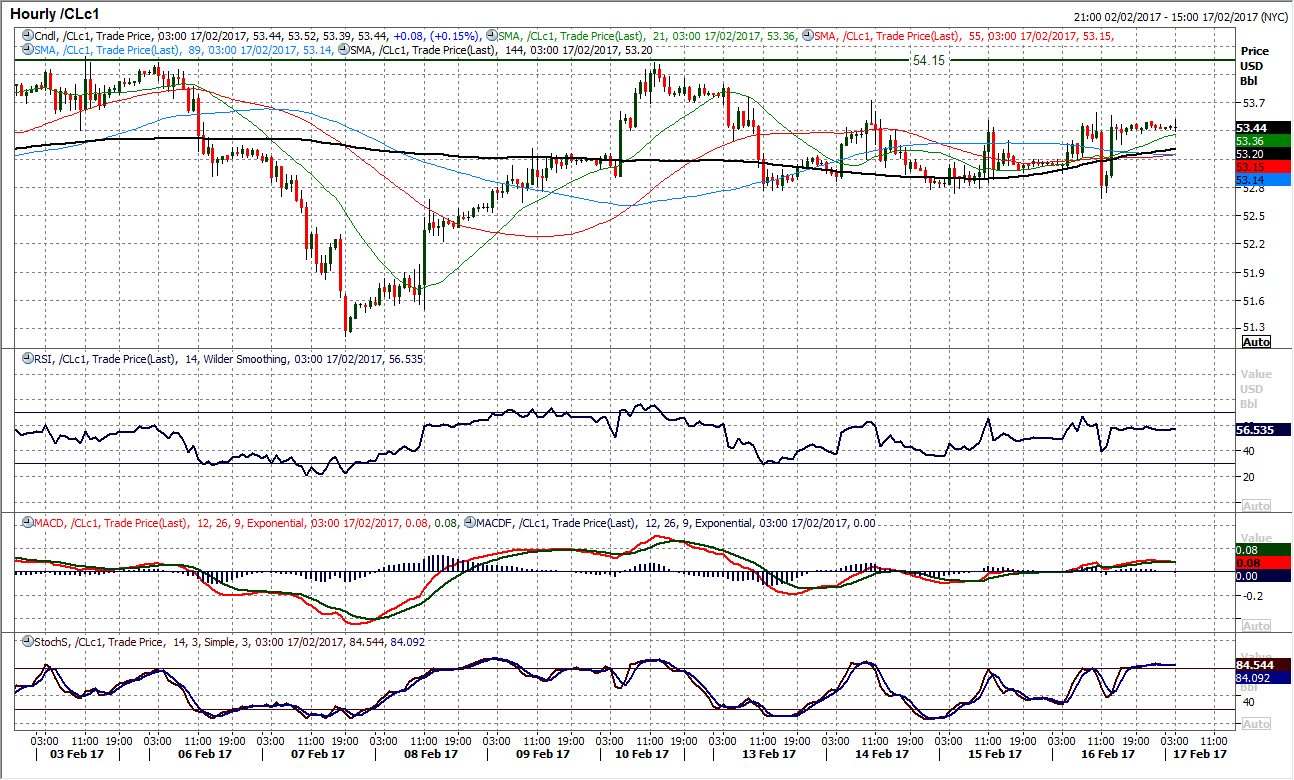
WTI Oil
The consolidation on oil continues. The market has been trading in a sideways range of just over $5 between $49.60 and $55.25 for the past couple of months. Trading above the $52.00 mid-range pivot leaves a mild positive bias which is reflected in the daily momentum indicators that are marginally all above their neutral levels. However the indicators have also plateaued and in the past few days as the market has struggled for any real direction. The intraday chart shows a basis of support around $52.75 in the past few days which again came under pressure yesterday but once more remains intact. There is a very rangebound outlook that has formed even on the hourly indicators which are oscillating around with a lack of direction. Selling pressure is coming in now above $53.50. Below $52.75 opens $52.00 but this is where the buyers will start to come back in again.
Author

Richard Perry
Independent Analyst


