Does gold want to move lower?

Gold’s slight rally might be getting some people excited, but appearances can be deceiving. USDX action hints at gold really wanting to move lower.
The yellow metal has climbed, but only with lacklustre energy. If the USD Index is not rising, then gold should really be shooting up and breaking new monthly highs, but it isn’t. Readers have been asking what’s happening and some have been concerned with gold’s apparent strength. So, let’s break it down.
History tends to rhyme and what happened before, will – to some degree - happen again. Gold is not immune to this concept, and the current implications are bearish.
Let’s jump right into the charts for details.
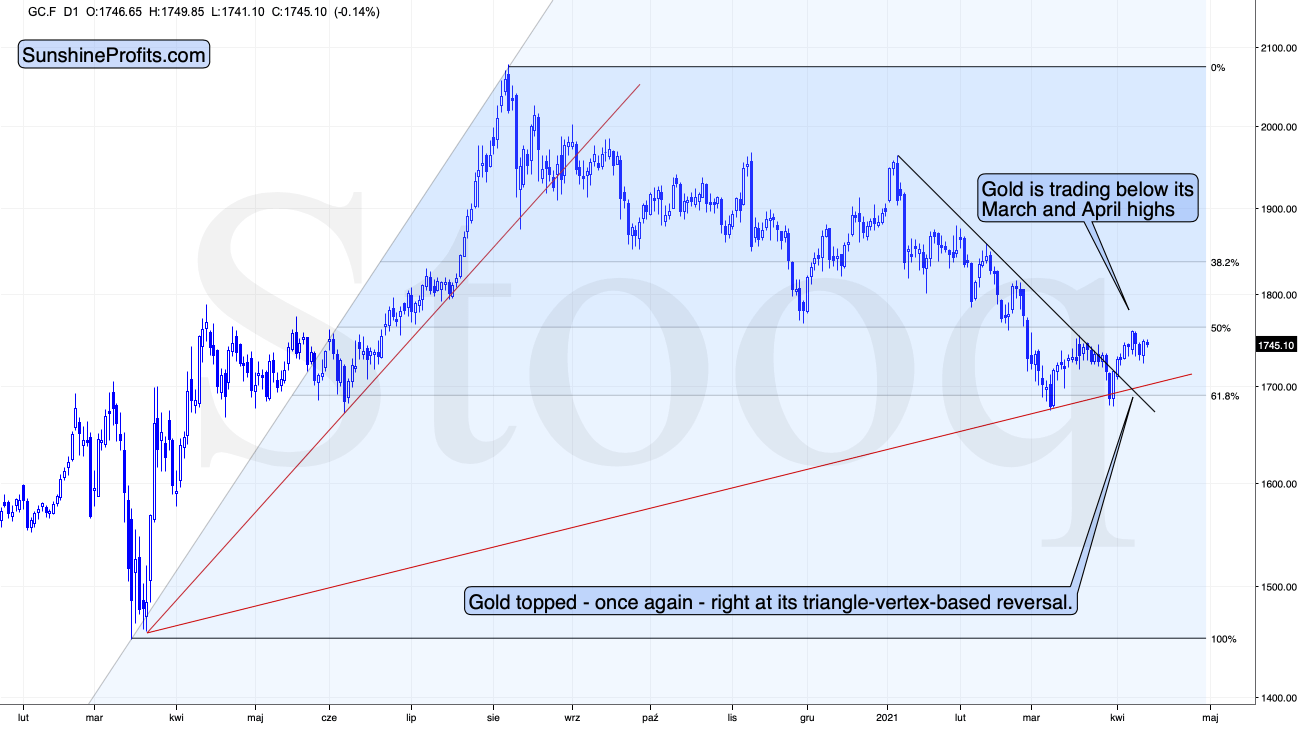
Gold topped right at its triangle-vertex-based reversal, just like it did in mid-March and in early January (please note the points that are marked on the above chart for confirmation – they are described in red). That happened on Thursday (Apr. 8), and since that time gold has continued to move lower.
Gold invalidated the breakout above its mid-March highs, proving that what we saw was nothing more than just an ABC (zigzag) correction within a bigger downswing. The moves that follow such corrections are likely to be similar to the moves that precede it. In this case, the move that preceded the correction was the 2021 decline of over $150. This means that another $150+ decline could have just begun.
It might appear bullish that gold rallied yesterday (Apr. 13), but it only appears this way until one compares this rally with what happened in the USD Index during the same time. Paying attention to today’s (Apr. 14) pre- market price moves further emphasizes the fake nature of yesterday’s rally in gold.
The point is not that gold rallied, but that it hasn’t rallied enough.
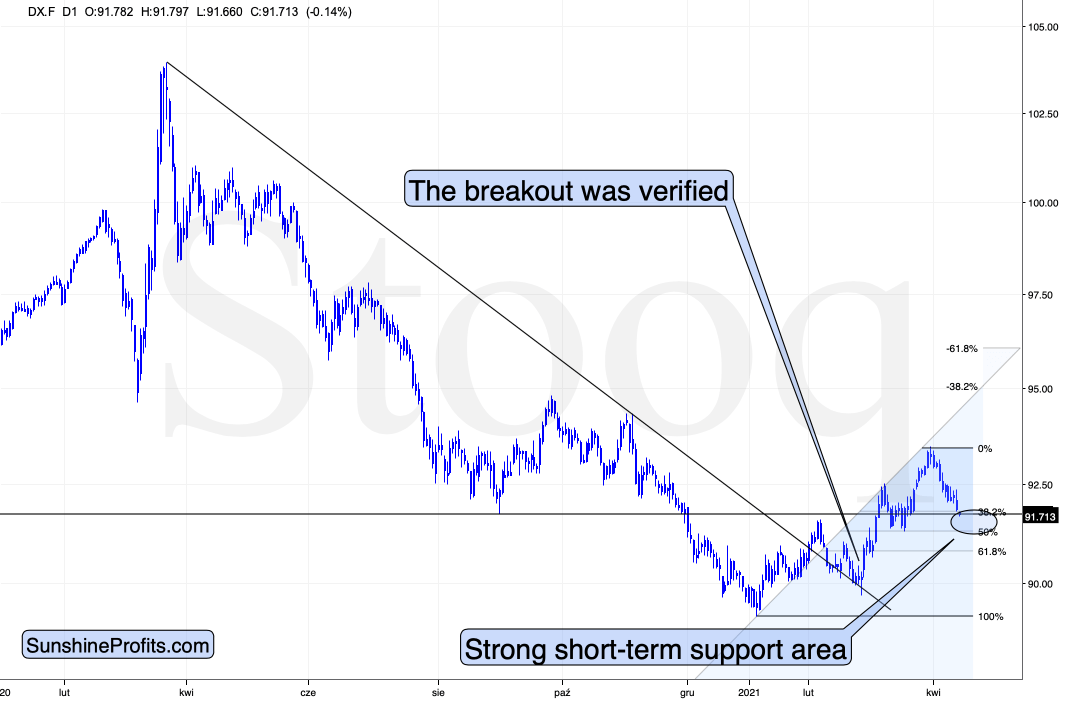
During yesterday’s session, the USD Index moved to new monthly lows and this decline continued in today’s pre- market trading. Consequently, if gold was at least reacting to the USD’s movement “normally”, it should move to new monthly highs. If gold “wanted” to rally, it would have likely exploded to the upside. But what happened instead? Gold moved higher only somewhat yesterday – not to new monthly highs – and in today’s pre-market trading it’s actually slightly lower.
This tells us that gold “wants” to move lower now.
The USD Index moved lower, and it can move even lower on a very short-term basis, perhaps to the 50% Fibonacci retracement based on the entire 2021 rally, and the previous lows. And what would be the likely effect on gold? Based on what we saw yesterday, and what we see so far today, it seems that gold will likely ignore this decline in the USD Index, while waiting for the latter to finally show strength – so that it (gold) could decline.
After all, gold has already topped right at its triangle-vertex-based reversal point . Consequently, it’s no wonder that it now continues to trade sideways, waiting for a trigger to move much lower.
Moreover, please note that the recent zigzag makes the situation similar (approximately symmetrical) to what we saw about a year ago – between April and early June. Once gold breaks to new yearly lows, one could view this as a breakdown below the neckline of a major head and shoulders pattern where the April 2020 – June 2020 and the recent consolidations are the shoulders of the pattern. Based on such a pattern, gold would be likely to slide profoundly, probably well below $1,500. And the relative performance of gold vs. the USD Index tells us that such a short-term breakdown (to new yearly lows) is a likely outcome in the following weeks.
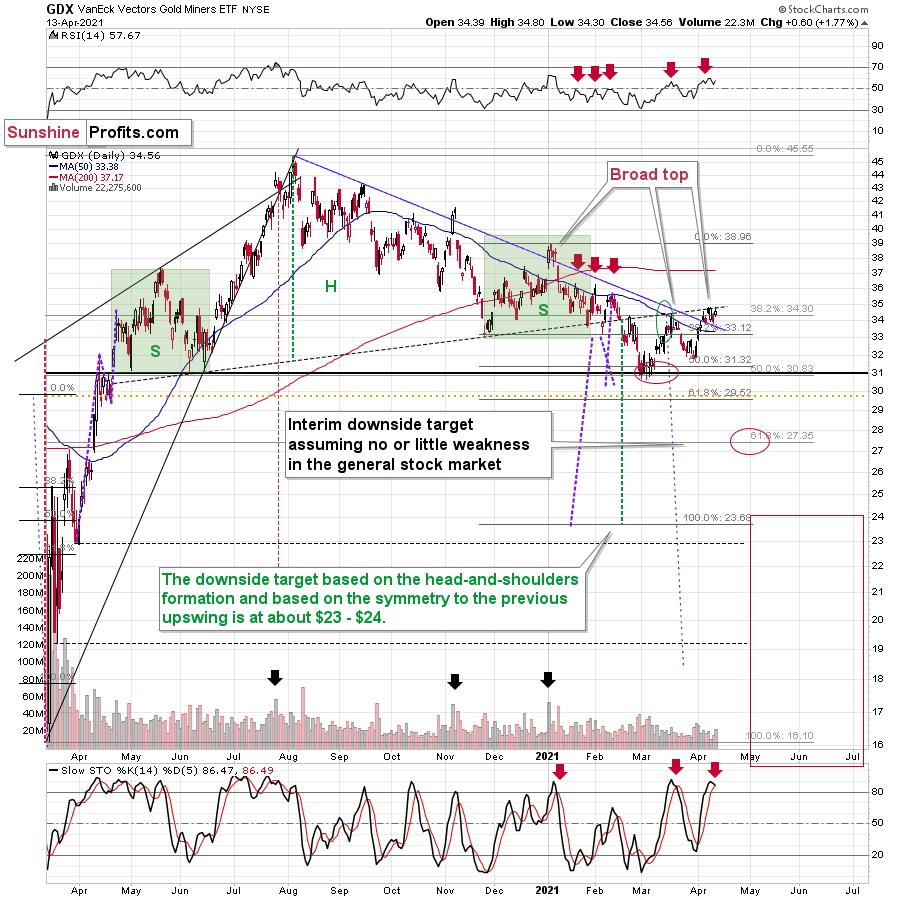
Gold stocks also failed to rally to new monthly highs, and they seem to be forming a relatively broad topping pattern, just as they did in mid-March and at the beginning of the year.
The sell signal from the Stochastic indicator as well as the fact that miners failed to invalidate the breakdown below their broad head-and-shoulders pattern points to a bearish outlook for the following weeks (and perhaps months).
All in all, the outlook for the precious metals market remains bearish and the recent rally didn’t change anything.
Want free follow-ups to the above article and details not available to 99%+ investors? Sign up to our free newsletter today!
Want free follow-ups to the above article and details not available to 99%+ investors? Sign up to our free newsletter today!
Author

Przemyslaw Radomski, CFA
Sunshine Profits
Przemyslaw Radomski, CFA (PR) is a precious metals investor and analyst who takes advantage of the emotionality on the markets, and invites you to do the same. His company, Sunshine Profits, publishes analytical software that any


