DAX30 – Next Bubble & Stock Exchange Crash – Full Elliott Wave Cycle

DAX30 – Stock Exchange Crash – When, How and Why?
According to the Analysis below DAX30 very much looks like it is possibly trading within an ABC Grand Super-Cycle (pink) and could possibly finalize the last 3 pieces of the puzzle for Super-Cycle Wave (V) (black) to complete the Bull Market.
Before you get to see my charts allow me to tell you this:
‘’I know how complicated it might look but believe me it’s not, just follow my lead and you’ll see.”
DAX30 – Monthly Chart:
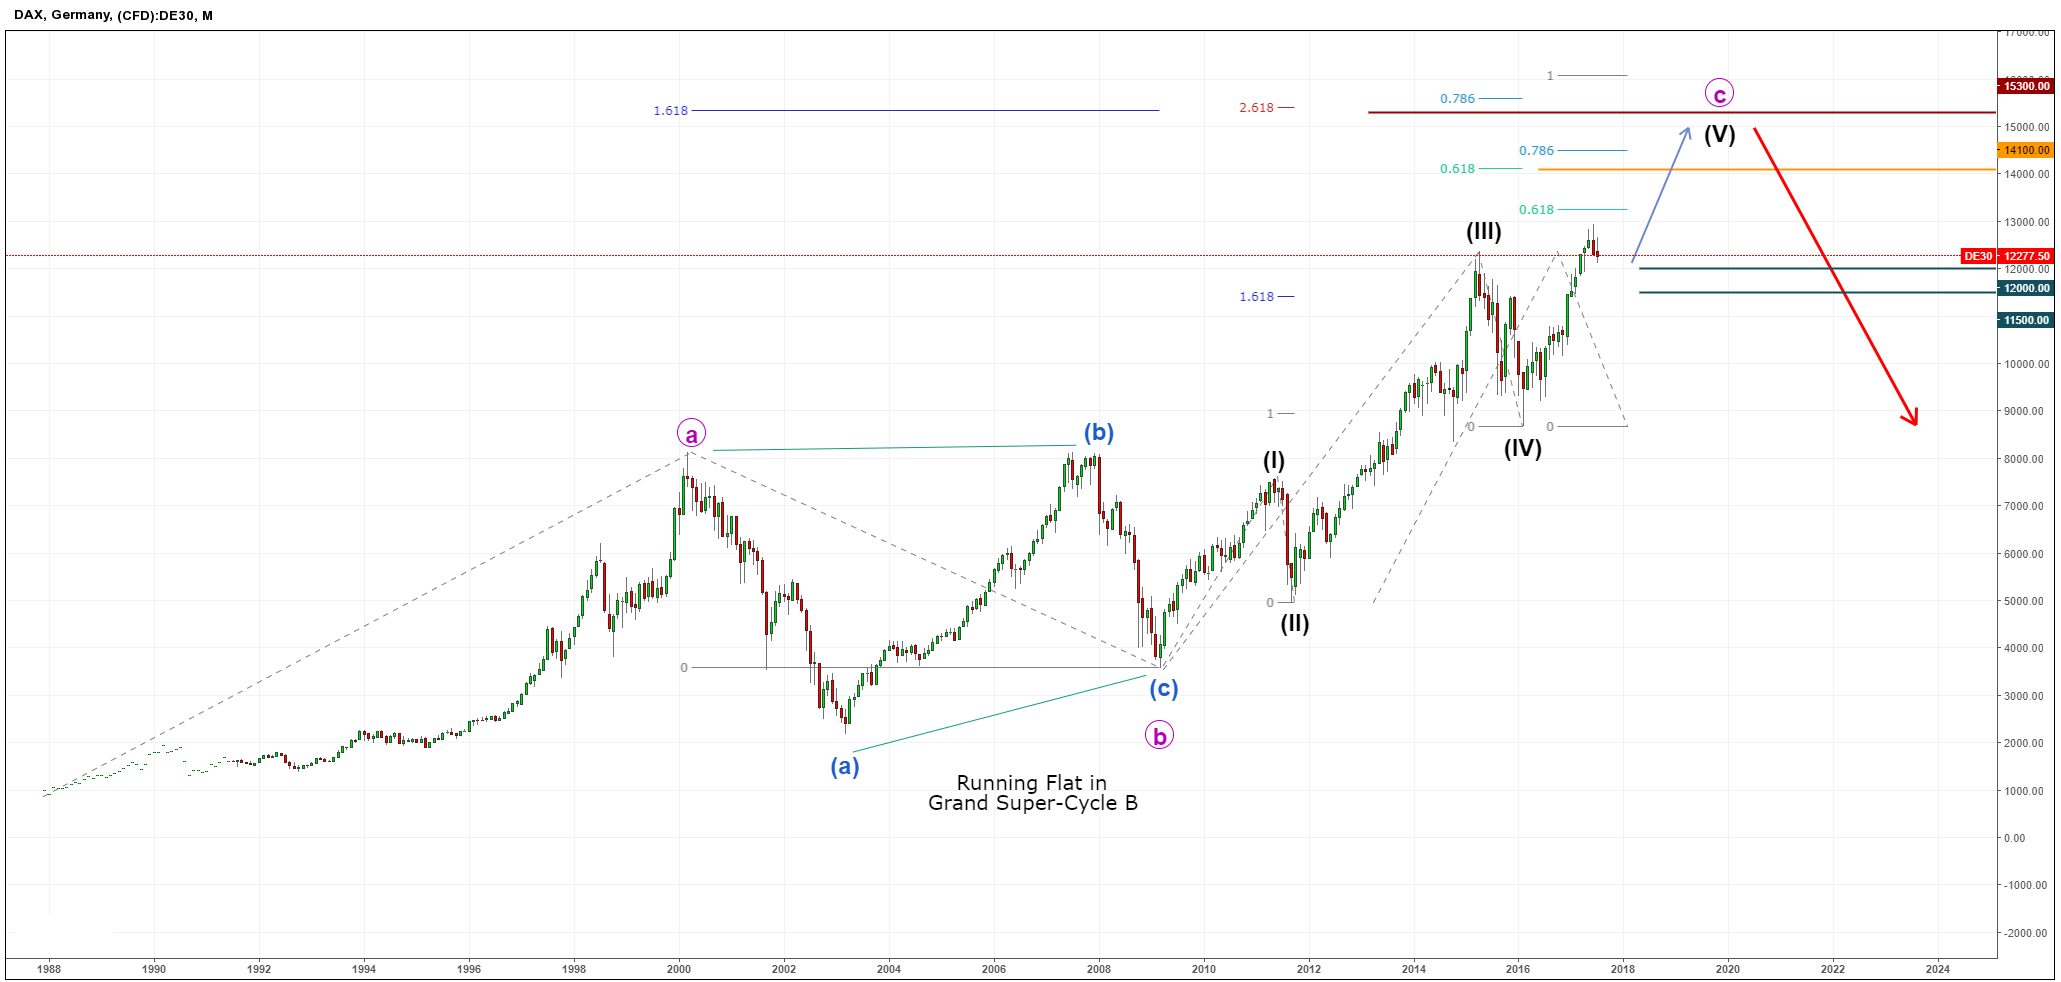
These are interesting times we are living and I personally believe that the Bull Market for DAX30 is coming to an end. Therefore, I will be looking in the near future for clearer signs of a Market Crash.
*Please note that this is my own opinion and it should not be treated as a direct investment advice.
The main focus for possible triggers are on China debt, US Housing, World-Wide Central Banks (negative interest rates) and possible Geo-Political Events.
Why DAX30 and not SPX?
I chose this EU Index for certain reasons, mostly because of how the next Market Crash or Recession would affect the EU Banking System and because it can offer a deeper move and a better gain.
Time-Line Speculation and Projections?
According to Time Cycles, these swings would take around 1 year to complete.
I am looking forward to Oct-Nov 2017 for the first signs and then Quarter 2 &3 of 2018 I will be closely watching the charts.
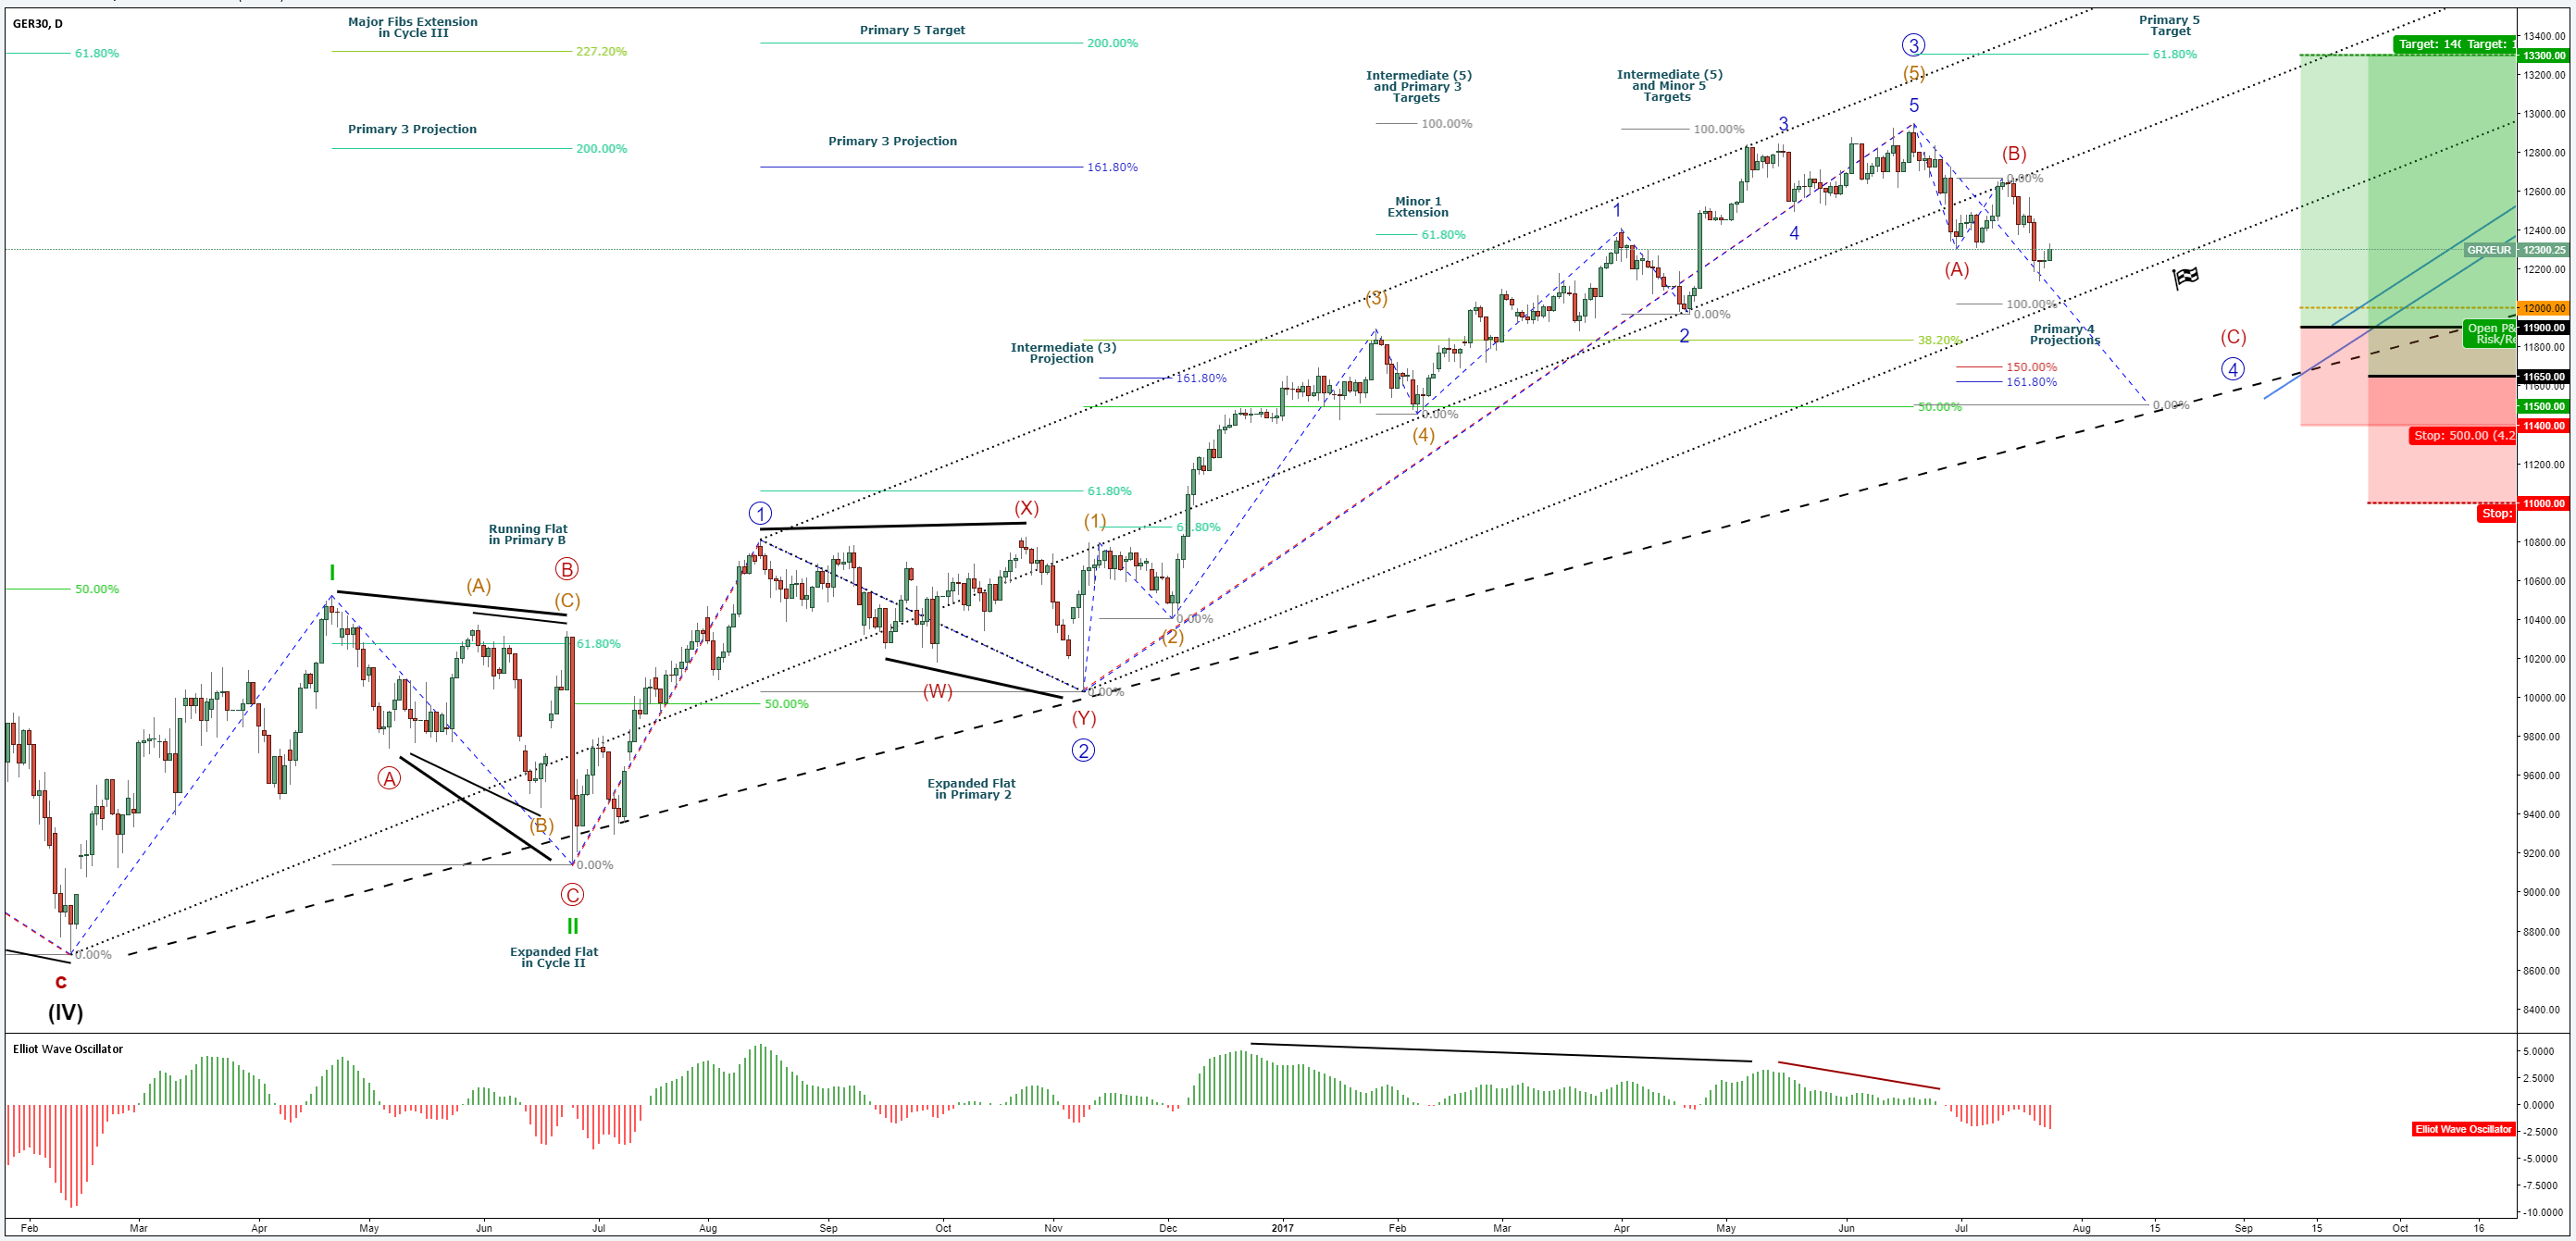
DAX30 – Daily Chart:
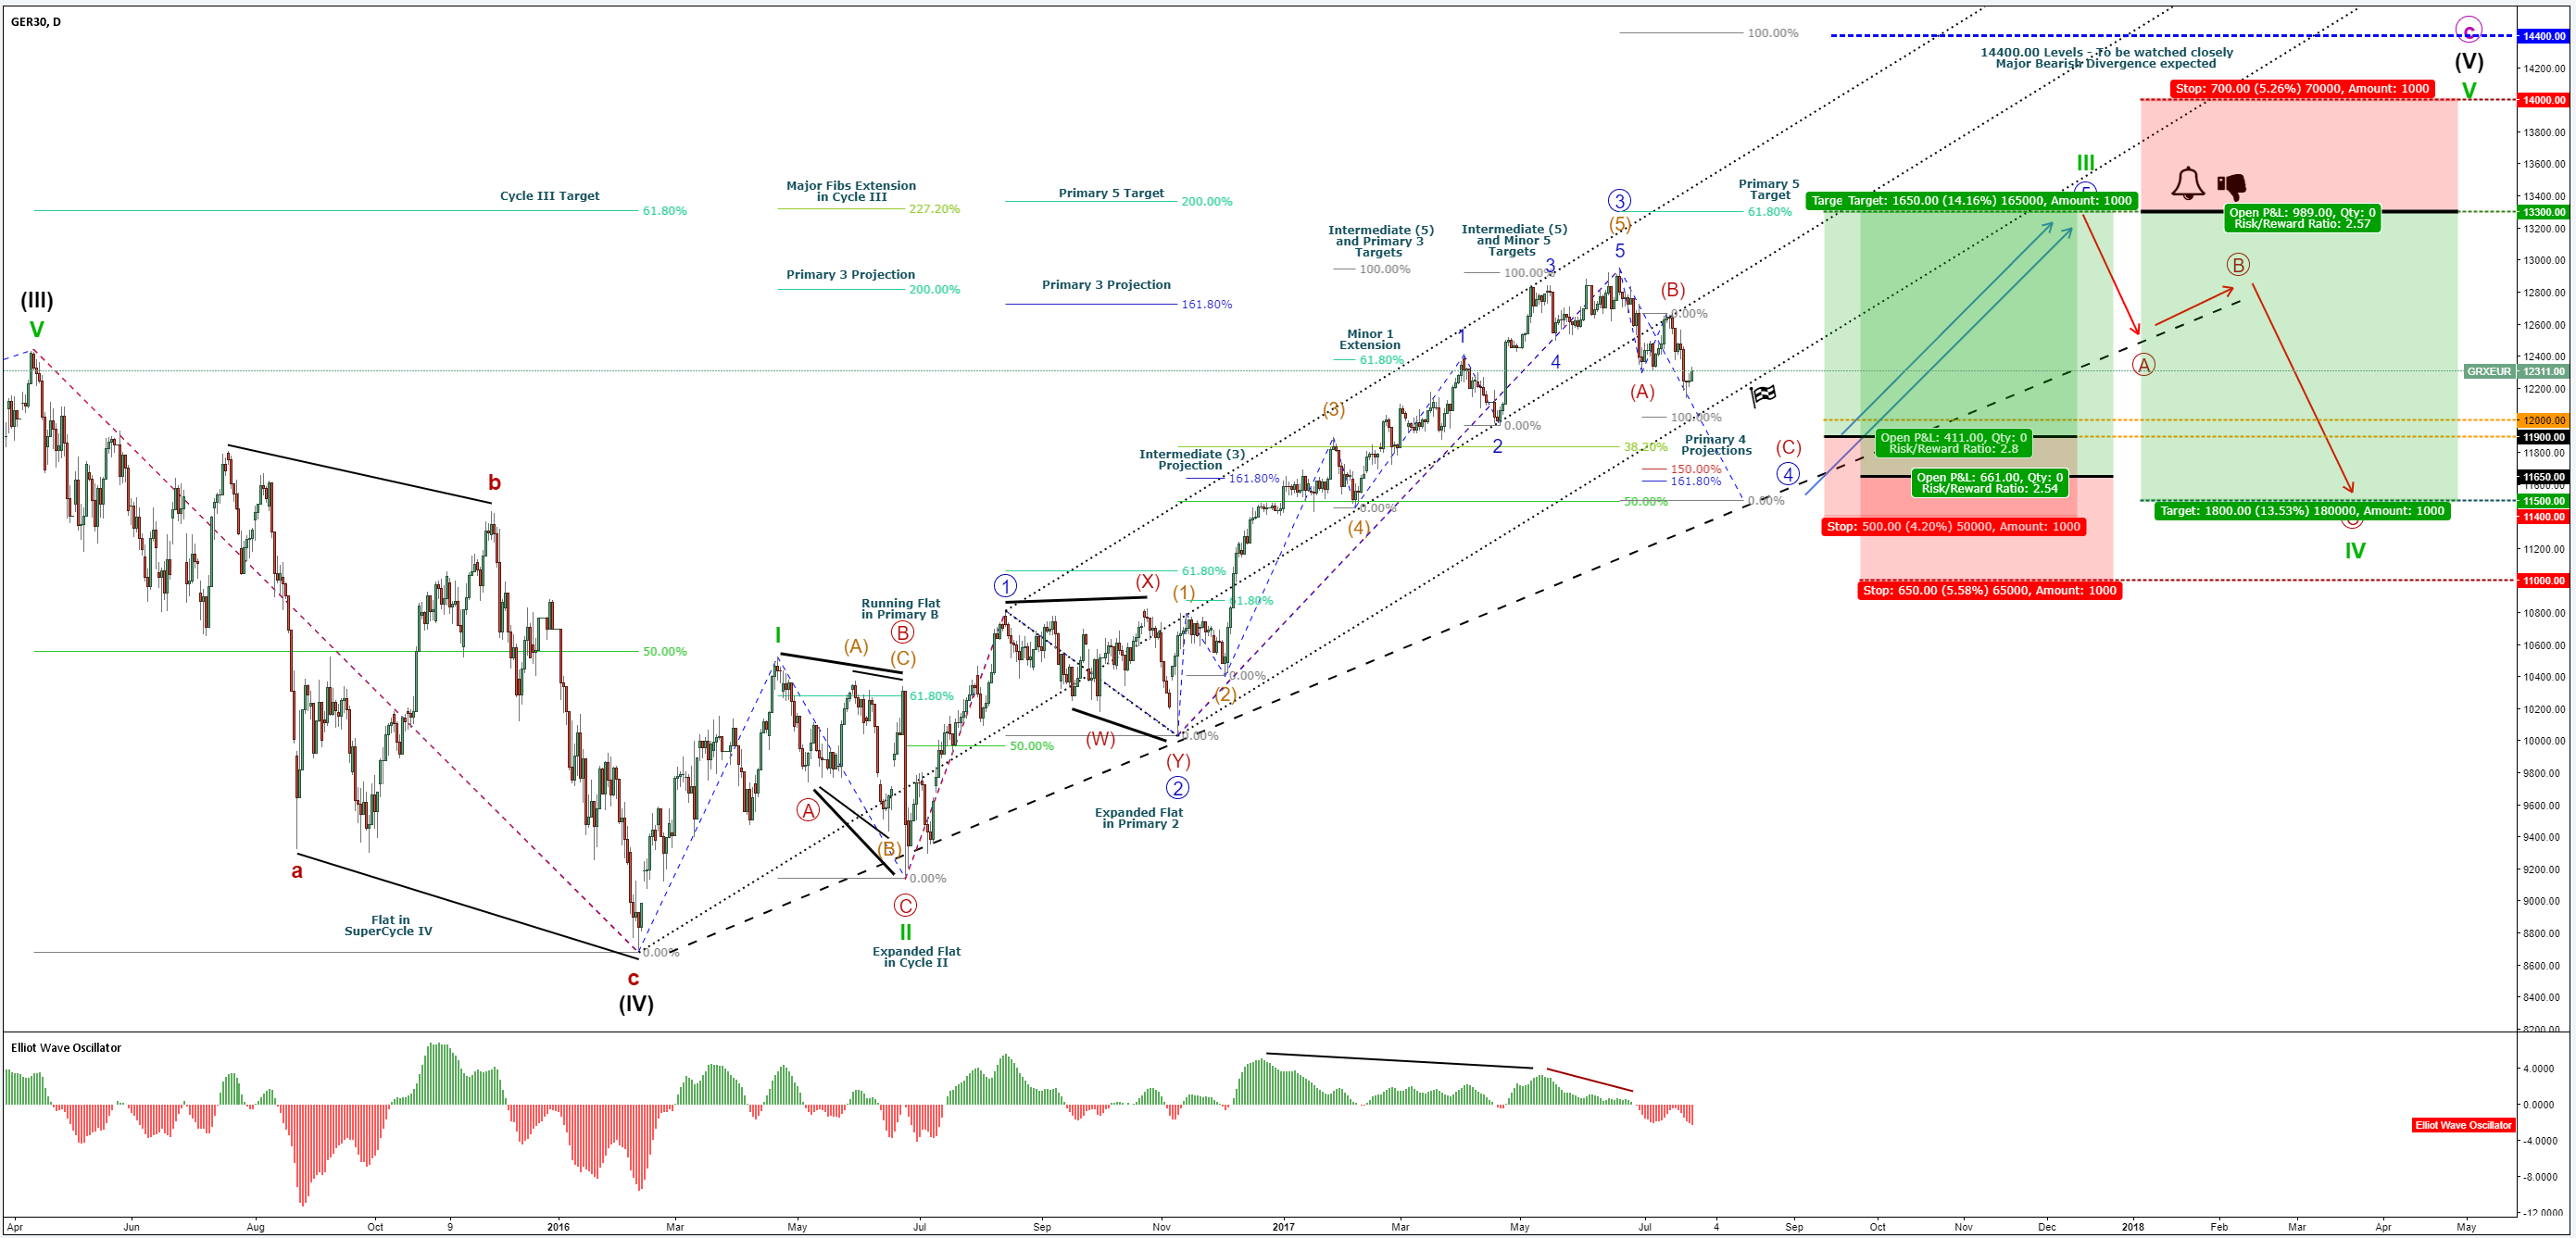
DAX30 – Full Cycle – Elliott Wave Analysis:
Within Grand Super-Cycle Wave C (pink), Super-Cycle (V) (black) would still need to complete the current Corrective Structure for Primary 4 (blue) and afterwards a Bullish Impulse for Primary 5 (blue), therefore, completing Cycle III (green).
As per the Optimism-Scepticism phenomenon within Dow Theory, Elliott Wave and Cycles, Cycle Wave IV (green) would be seen as a Major Sell-Off and a possible trigger for what’s later to come.
A possible Market Shift could already be visible on EURUSD, as per the ‘’ EURO/DOLLAR-EUR/USD – Descending Bearish Channel – Elliott Wave Cycle “ post.
EURUSD – Correlation - Levels in Focus – 1.18500 & 1.19500
DAX30 – Wave Count Break-Down:
Cycle III (green) Analysis:
-
Cycle Wave I (green) moved with its Bullish Impulses until 50% Fibonacci Retracements of Super-Cycle IV (black).
-
Cycle Wave II (green) has shown a Deep Corrective Structure under an Expanded Flat form, with a Running Flat Structure inside its Primary B (red) sub-wave.
-
Cycle Wave III (green) started the Bullish Cycle with Primary 1 (blue), followed by a deep Bearish and Complex Corrective WXY (red) Intermediate.
Due to the fact that this Correction is overlapping with Cycle Wave I (green), it is excluded to think that Primary 1 (blue) can act as a Cycle Wave III (green).
Here’s why:
-
According to one of the main Elliott Wave Rules and R.N. Elliot’s Legacy, Cycle Wave IV (green) (which in this case it would replace Primary 2 (blue)), would be entering Cycle Wave I (green) territory and would act as a Wave Count Violation.
-
Cycle Wave III (green) would act as the shortest wave, with limited power, violating and trying to bend another main Elliott Wave Rule.
Conclusion:
- Cycle Wave III (green) presents an Extension in its Primary (blue) Sequence, also pointing out a Major Rally and Extension in Primary 3 (blue), with the Intermediate (orange) sub-waves unfolding within a Bullish Channel.
Let’s continue with the Wave Count!
-
Primary 2 (blue) retraced as an Expanded Flat, with a 50% Fibonacci Retracement of Primary 1 (blue) which is quite common for this Index.
-
Primary 3 (blue) presents an extension in Intermediate (3) (orange), as pointed out by the 161.8 % Fibonacci Extensions of Intermediates (1) & (2) (orange).
-
Intermediate (5) (orange) ends the Bullish rally with a Bearish Divergence at the 100% Fibonacci Extensions of Intermediates (3) & (4) (orange).
-
Intermediate (5) (orange) presents an Extension in Minor 1 (blue), with the next Impulses Minors 3 & 5 (blue) completing at the 100% Fibonacci Extensions of Minors 1 & 2 (blue).
Cycle Wave III (green) Analysis:
Fibonacci Extensions & Levels in Focus:
The Levels in Focus for the possible end of the Cycle Wave III (green) are 13300.00 and here is why:
-
61.8% Fibonacci Extensions of Super-Cycle Waves (III) & (IV) (black), Target for Cycle III (green).
-
227.20% Major Fibonacci Extensions of Cycle Waves I & II (green), Target for Cycle III (green).
-
200% Fibonacci Extensions of Primary Waves 1 & 2 (blue), Target for Primary 5 (blue).
-
61.8% Fibonacci Extensions of Primary Waves 3 & 4 (blue), Target for Primary 5 (blue).
Primary 4 (blue) – Speculation & Projections:
Levels in Focus for the possible end of the current unfolding wave Primary 4 (blue) are:
-
Range of 12000.00 & 11900.00
100% Fibonacci Extensions of Intermediate Corrective Waves (A) & (B) (red). -
11650.00
150-161.8% Fibonacci Extensions of Intermediate Corrective Waves (A) & (B) (red), if Intermediate (C) should have an Extension.
If such Scenario would occur, one would look for a Breach of Pitchfork & the Channel’s Lower Trend-Line and then a possible Flag Formation.
DAX30 – Daily Chart (close-up):
DAX30 – Possible BULLISH Scenarios – Primary 5 (blue) & Cycle III (green):
Levels:
-
Aggressive – 12000.00 or 11900.00
Invalidation – 11400.00
Target – 13300.00 -
Moderate – 11650.00
Invalidation – 11000.00
Target – 13300.00 -
Conservative – 11500.00
Invalidation – 11000.00
Target – 13300.00
DAX30 – Possible BEARISH Scenario – Cycle IV (green):
Projected Level:
- 13300.00
Invalidation – 14000.00
Target – 11500.00
*To be noted that BEARISH Levels are to be considered just as a projection an have high chances of changing, with new measurements occuring once Price Action unfolds.
Safety Measures:
– When in the green, one would move the SL break-even or in profit.
– If Conservative, one would wait for a reaction at the Channel Base Line, also look for a Breach and then a Flag which could confirm the Conservative Levels.
* The above Analysis does not act as a direct investment advice and should be treated as market commentary.
Many pips ahead!
RT
P.S. Possible Level for Stock Exchange Crash – 14400.00
* To be continued.
Author

Richard Tataru
XGlobal Markets
Richard is a market analyst and holds the role of Senior Account Manager at XGLOBAL Markets. He is passionate about technical analysis and has been exploring the charts for years.


