EUR/USD – Descending Bearish Channel – Elliott Wave Cycle

EUR/USD has been trading since March 2015 what seems to be a very possible Descending Channel and a Complex Corrective ABCDE Structure which is very common for a Wave 4 in Elliott Wave Analysis.
Recent comments on monetary policy from Mario Draghi (ECB President) pushed EUR/USD towards new yearly highs which is exactly what was needed in order to have the last piece of the puzzle for the possible Wave Count.
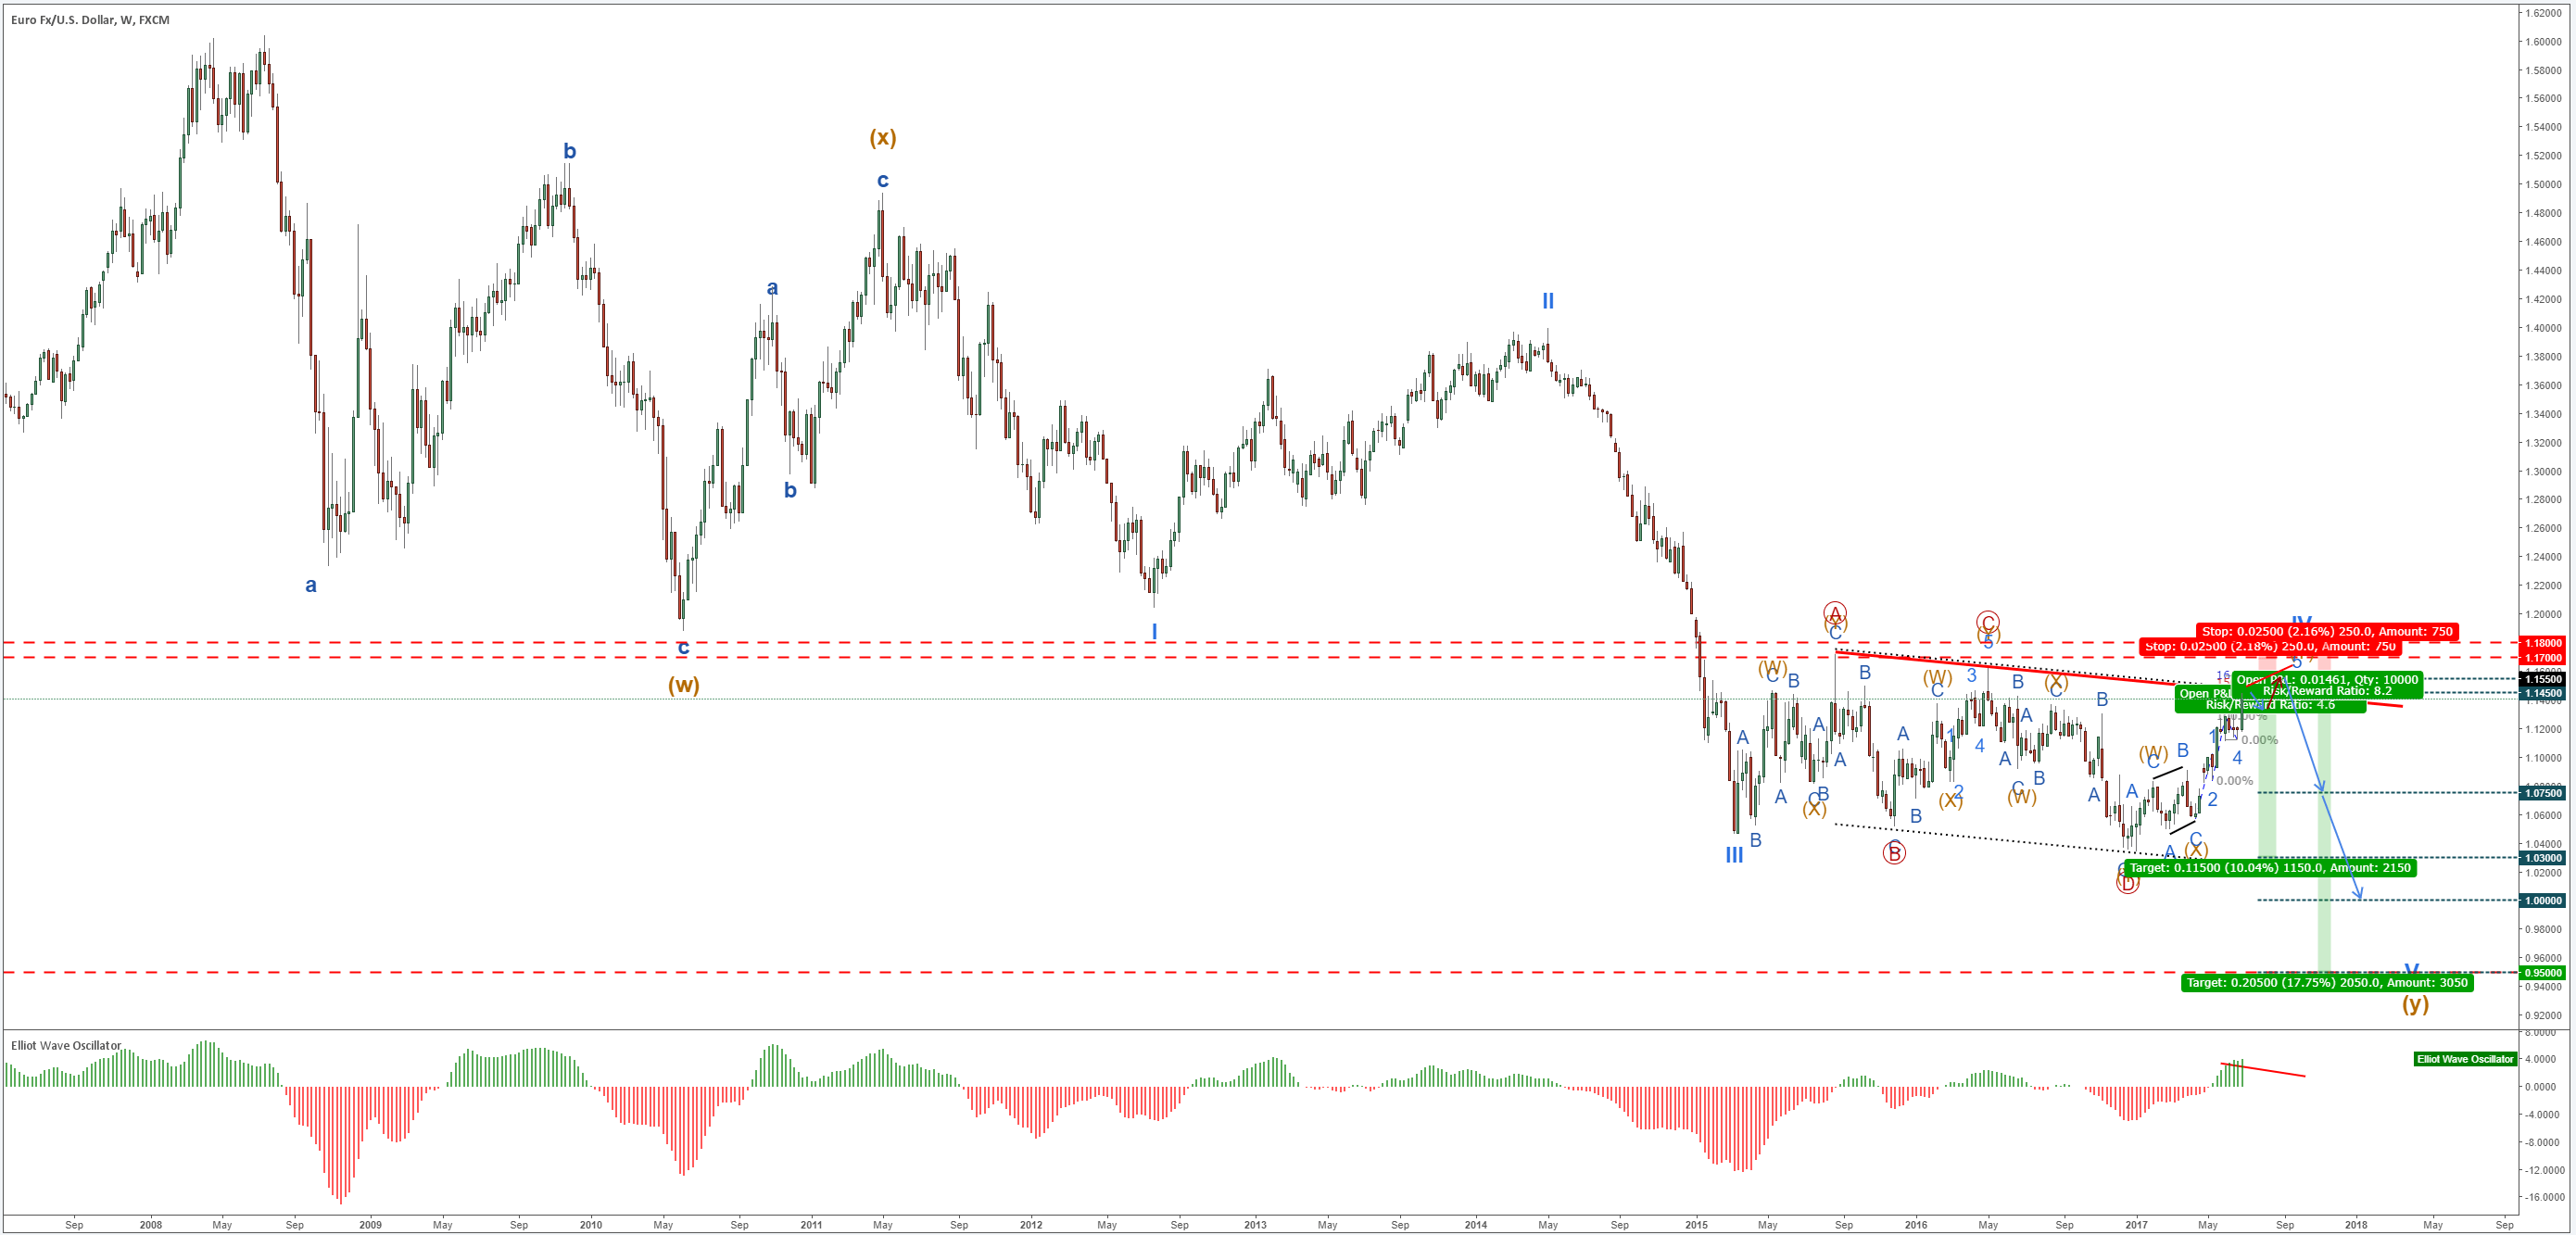
If we take a look at the Weekly Chart we can spot what seems to be a Complex WXY Bearish Corrective Super-Cycle (orange).
Weekly Chart:
By zooming into the Daily Chart we can see that EUR/USD is probably painting an Elliott Wave Sell Set-Up which would be very attractive for Bears.
Complex Descending Channel Structure:
The Chart Labeling states that the Descending Channel is unfolding under a Complex ABCDE Structure (red), under the Primary scale.
Each Primary Wave (red) is labelled with a 3 Wave Sequence under the sub-waves and Intermediate scale WXY (orange). The Intermediate Waves (orange) are also sub-divided with ABC Minor Waves (light blue).
Daily Chart:
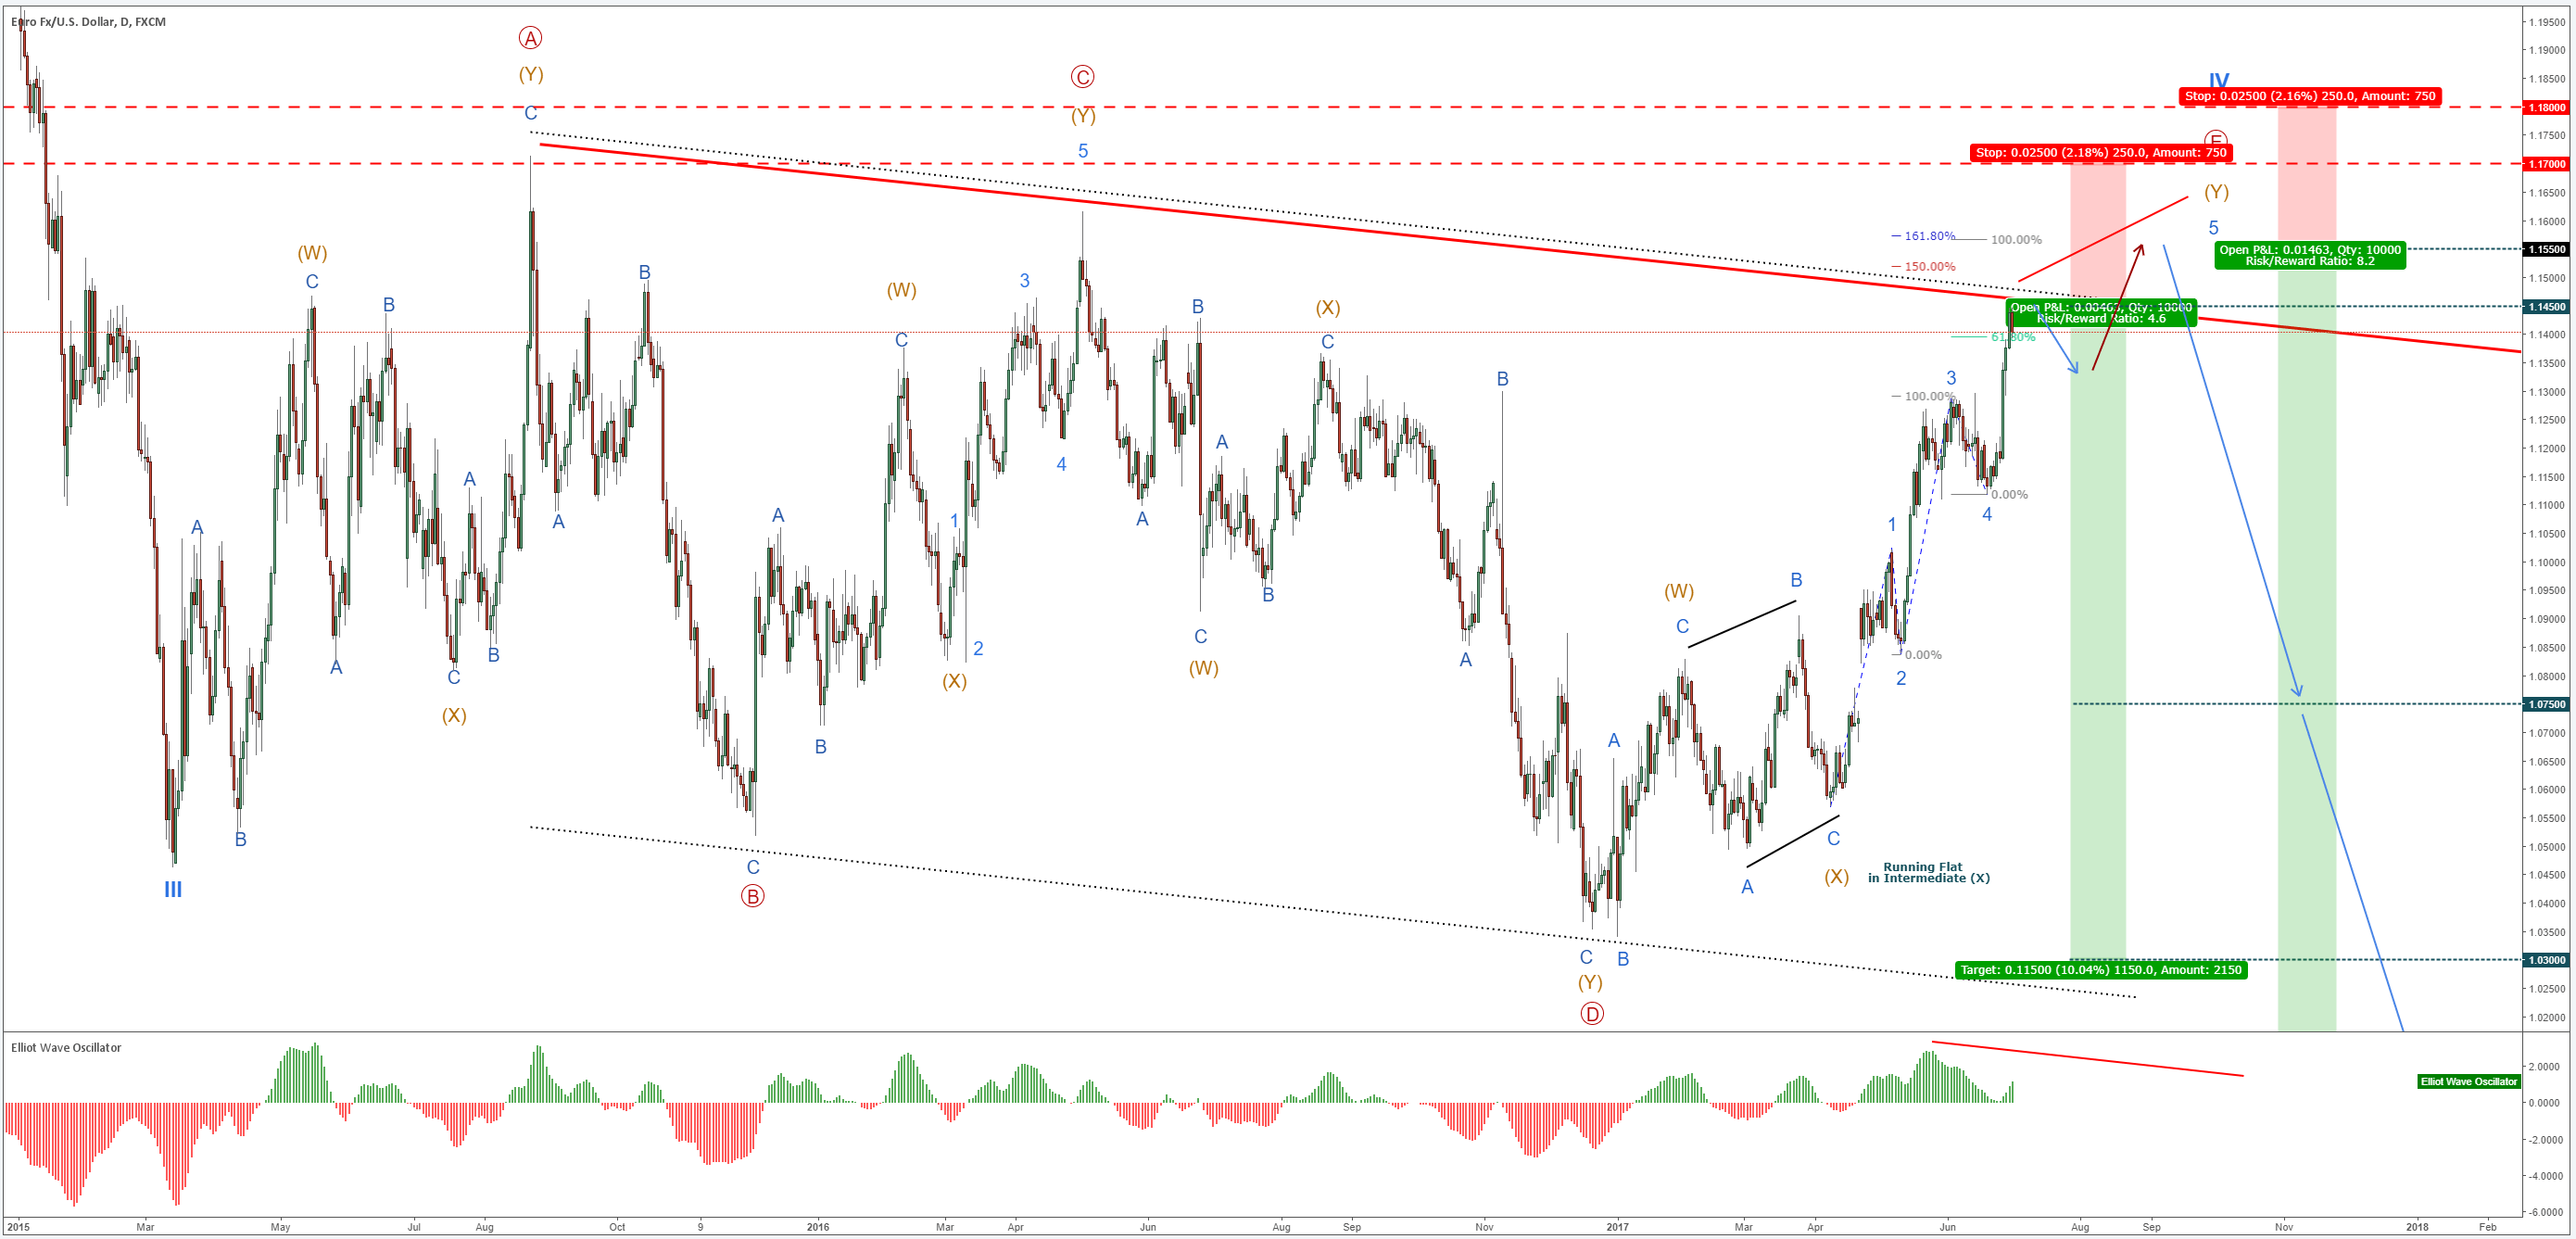
Obviously the focus now would be on Primary Wave E (red) which seems to have unfolded with a Running Flat in Intermediate (X) (orange) and an Extension in Intermediate (Y) (orange).
According to the Wave Count, EUR/USD is possibly and finally showing an end to the Corrective Cycle IV (light blue), leaving room for the Bearish Cycle to possibly continue and finalize the last leg, Cycle V (light blue).
Intermediate (Y) (orange) Fibonacci & Measurements:
-
Minor 3 (light blue) ends at the 100% Fibonacci Extensions of Minor 1 & 2 (light blue).
-
Minor 5’s end is projected with the 61.8-100% Fibonacci Extensions of Minor 3 & 4 (light blue).
*The current Wave Count is stating that Minor % (light blue) still has a bit more room upwards in order to complete its Cycle and sub-waves.
Possible Levels in Focus for Bears:
1.14500 & 1.15500
Invalidations:
1.17000 & 1.18000
Targets:
1 – 1.07500
2 – 1.03000
3 – 1.00000
4 – 0.95000
*Possible Safety Measures:
- One would look for confirmation coming from a Bearish Divergence at the end of Minor 5 (light blue).
- Moving SL at break-even or in the green
Many pips ahead!
RT
Author

Richard Tataru
XGlobal Markets
Richard is a market analyst and holds the role of Senior Account Manager at XGLOBAL Markets. He is passionate about technical analysis and has been exploring the charts for years.


