DAX shows uncertainty at fibonacci level
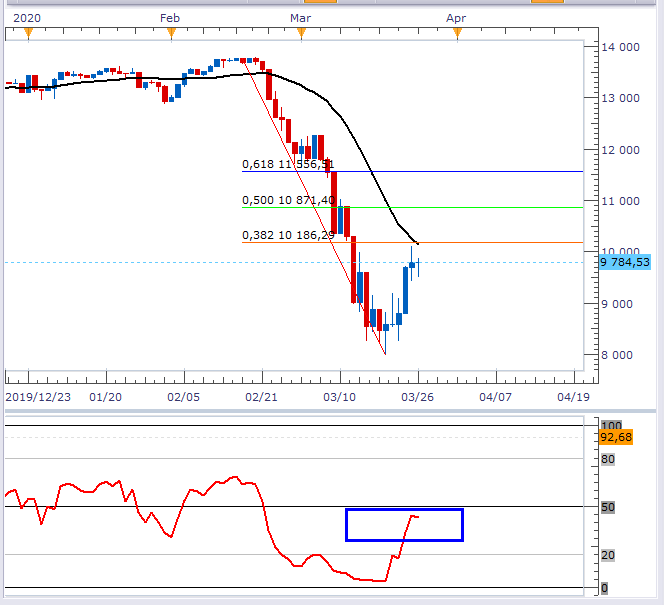
The chart below shows the daily time frame of the GER30. The candlesticks over the last 2 days have been interesting. Yesterday’s candle shows a spinning top, which is a candle of uncertainty, and today’s candle (still to complete) shows an inside day, which confirms this uncertainty. This, after a very strong Monday session. The uncertainty as reflected in current price action comes at the 38.2% Fibonacci, which overlaps with 20-day SMA resistance. Moreover, the RSI is still below 50 (blue rectangle) and has not crossed into bullish territory yet. If these levels continue to hold price at bay and market bulls are not able to shake their uncertainty than the index may be susceptible to another bout of weakness.
Past performance is not an indicator of future results
CHART SOURCE: FXCM MARKETSCOPE 2.0
Author

Russell Shor (MSTA, CFTe, MFTA) has an Honours Degree in Economics from the University of South Africa and holds the coveted Certified Financial Technician and Master of Financial Technical Analysis qualifications from the Interna


