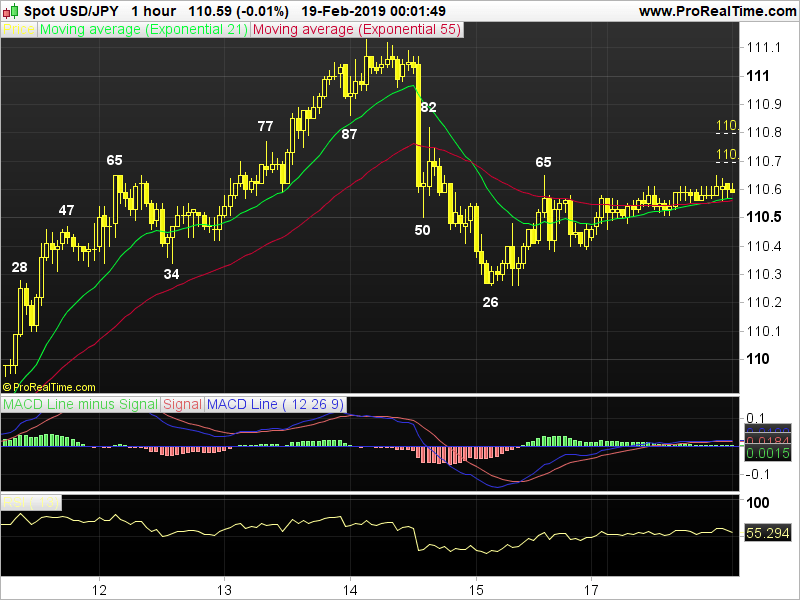
Daily Technical Outlook on Major - USD/JPY


Last Update At 19 Feb 2019 00:01GMT
Trend Daily Chart
Sideways
Daily Indicators
Rising
21 HR EMA
110.56
55 HR EMA
110.55
Trend Hourly Chart
Sideways
Hourly Indicators
Rising
13 HR RSI
57
14 HR DMI
+ve
Daily Analysis
Consolidation with downside bias
Resistance
111.13 - Last Thur's fresh 6-week high
110.87 - Last Thur's Asian low (now res)
110.65 - Last Fri's high
Support
110.26 - Last Fri's low
109.90 - Feb 08 high (now sup)
109.61 - Feb 07 low
. USD/JPY - 110.59.. The greenback gained in NZ y'day to 110.58 ahead of Asian open on U.S.-China trade optimism n continued to trade with a firm bias, hitting 110.65 in holiday-thinned N. American session on increased risk appetite.
. On the bigger picture, dlr's fall fm 118.66 (Dec 2016) to 107.32 in 2017 (Sep) confirms uptrend fm 2016 29-month bottom at 99.00 has made a top. Despite staging a strg rise fm 2018 16-month bottom at to 104.57 to as high as 114.55 in Oct, dlr's fall to 109.57 on last trading day in 2018, then flash crash to a 9- month low at 104.79 early Jan on stop selling confirms correction fm 104.57 has ended. Having said that, last week's gain to 111.13 suggests choppy trading abv 104.57 would continue but abv 111.40 needed to bring stronger retracement to 112. 24 later. A daily close below 108.50 would signal correcton is over, then price would head to 107.77 in late Feb but 104.79 should remain intact.
. Today, although usd has recovered after selloff fm last Thur's 111.13 top to 110.26 Fri n minor consolidation wud be seen, as said move signals recent rise has made a top there, reckon 110.69 (50% r) wud cap upside n yield another fall. Below 110.26 wud extend twds 109.90 whilst abv 110.87 wud risk 111.13
Interested in USDJPY technicals? Check out the key levels
Author

AceTrader Team
AceTrader
Led by world-renowned technical analyst Wilson Leung, we have a team of 7 analysts monitoring the market and updating our recommendations and commentaries 24 hours a day.
More from AceTrader Team


