Daily Technical Outlook on Major - USD/JPY


Last Update At 16 Aug 2018 00:22GMT
Trend Daily Chart
Sideways
Daily Indicators
Turning down
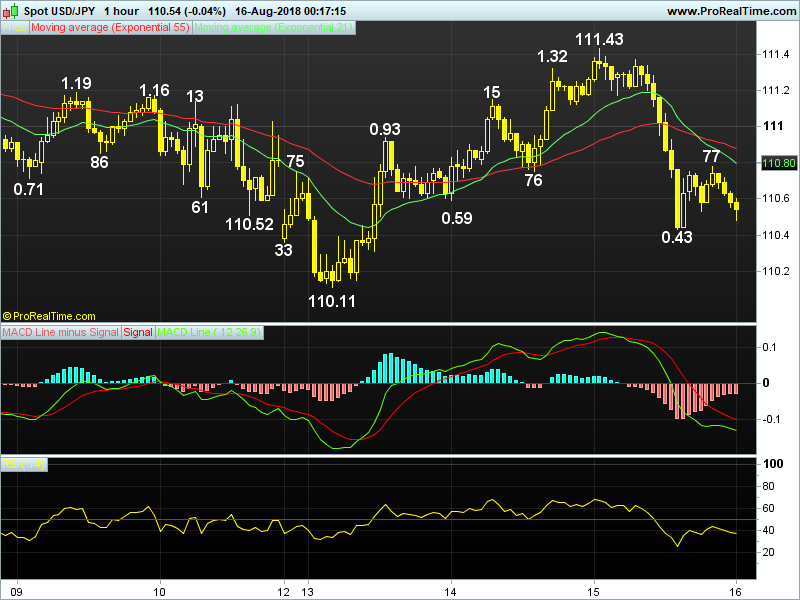
21 HR EMA
110.80
55 HR EMA
110.88
Trend Hourly Chart
Sideways
Hourly Indicators
Falling
13 HR RSI
37
14 HR DMI
-ve
Daily Analysis
Choppy consolidation to continue
Resistance
111.88 - Aug 03 high
111.43 - Y'day's high
110.93 - Mon's high
Support
110.43 - Y'day's low
110.11 - Mon's 6-week low
109.88 - 38.2% r of 104.57-113.17
-
USD/JPY - 110.56.. Although dlr climbed to 111.43 in Asian morning on Wed , renewed weakness in CNY n falling Asian stocks triggered safe-haven yen buying , intra-day decline accelerated in NY on falling US yields, price hit 110.56.
-
On the bigger picture, dlr's fall fm 118.66 (Dec 2016) to 107.32 in 2017 (Sep) confirms uptrend fm 2016 29-month bottom at 99.00 has made a top. Despite weakness to a 16-month low of 104.57 in Mar, subsequent rally to Jul's 6-month peak signals recent decline has ended as this level was accompanied by 'bullish convergences' on daily indicators. However, dlr's selloff to 110.59 in Jul, then 110.11 y'day confirms the long-awaited correction of said rise has occured n fur- ther weakness to 109.88 (min. 38.2% r) is envisaged after consolidation, below there is needed to extend to 109.20/37 area later. Only a daily close abv 112.15 would risk gain to 112.80, break would yield re-test of 113.17, 113.75.
-
Today, dlr's retreat fm 111.43 suggests early rise fm Mon's 6-week low at 110.11 has possibly ended n firm break of 110.33/43 sup would bring re-test of 110.11, then 109.88, 'bullish convergences' on hourly indicators would keep price abv 109.55/60. On the upside, abv 111.00 may head twd 111.43, 111.70/80.
Author

AceTrader Team
AceTrader
Led by world-renowned technical analyst Wilson Leung, we have a team of 7 analysts monitoring the market and updating our recommendations and commentaries 24 hours a day.


