Daily Technical Outlook on Major - USD/JPY


Last Update At 13 Oct 2017 00:13GMT
Trend Daily Chart
Up
Daily Indicators
Rising
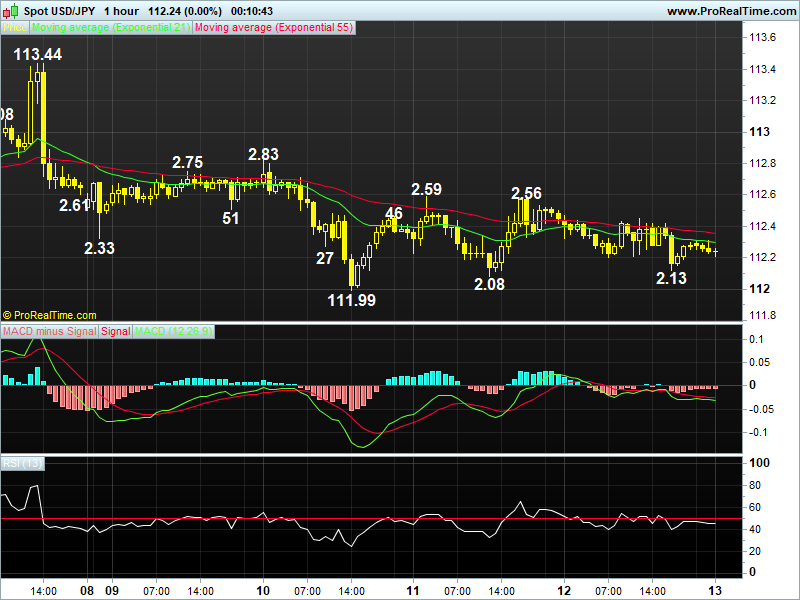
21 HR EMA
112.29
55 HR EMA
112.36
Trend Hourly Chart
Sideways
Hourly Indicators
Neutral
13 HR RSI
44
14 HR DMI
-ve
Daily Analysis
Choppy consolidation b4 one more fall
Resistance
113.08 - Last Fri's European high
112.83 - Tue's high
112.59 - Wed's high
Support
111.99 - Tue's low
111.80 - Prev. hourly res (now sup)
111.48 - Sep 25 low
-
USD/JPY - 112.24.. Dlr traded sideways in lacklustre Thur's session inside near term established range of 111.99-112.59 as focus was on other G4 currencies. Price edged lower to 112.13 in NY b4 inching higher at the close.
-
On the daily chart, despite dlr's resumption of MT decline fm 118.66 (Dec 2016) to retrace early uptrend fm 2016 29-month bottom at 99.00 to 107.32 in early Sep, subsequent impressive rally on rising U.S. yields to a 2-month of 113.26 in Sep confirms aforesaid decline has formed a low there as this lvl was also accompanied by 'bullish converging signals' on the daily indicators n upside bias remains for gain to 113.58, o/bot readings on the daily indicators are expected to cap price at 114.49 (Jul high) n risk is seen for a correction of aforesaid rise fm 107.32. Having said that, dlr's decline fm 113.44 last Fri signals temp. top made n may head twd sup at 111.48 but 111.10 (38.2% r) hold.
-
Today, dlr's choppy trading fm 111.99 suggests 1st leg of correction fm last Fri's 113.44 top has ended n more consolidation is seen, reckon res 112.83 would cap present rise n yield another decline, however, 'bullish convergences' on hourly indicators would keep price abv 111.48. Only abv 113.08 risks 113.44.
Author

AceTrader Team
AceTrader
Led by world-renowned technical analyst Wilson Leung, we have a team of 7 analysts monitoring the market and updating our recommendations and commentaries 24 hours a day.


