Daily Technical Outlook on Major -USD/JPY

Last Update At 15 Sep 2017 01:43GMT
Trend Daily Chart
Sideways
Daily Indicators
Bullish convergences
21 HR EMA
110.34
55 HR EMA
110.22
Trend Hourly Chart
Sideways
Hourly Indicators
Falling
13 HR RSI
43
14 HR DMI
-ve
Daily Analysis
Consolidation with downside bias
Resistance
111.05 - Aug high (4th)
110.73 - Y'day's Asian high
110.32 - Y'day's NY morning low (now res)
Support
109.55 - Intra-day low (Reuters)
109.24 - Tue's low
108.74 - 61.8% r of 107.32-111.04
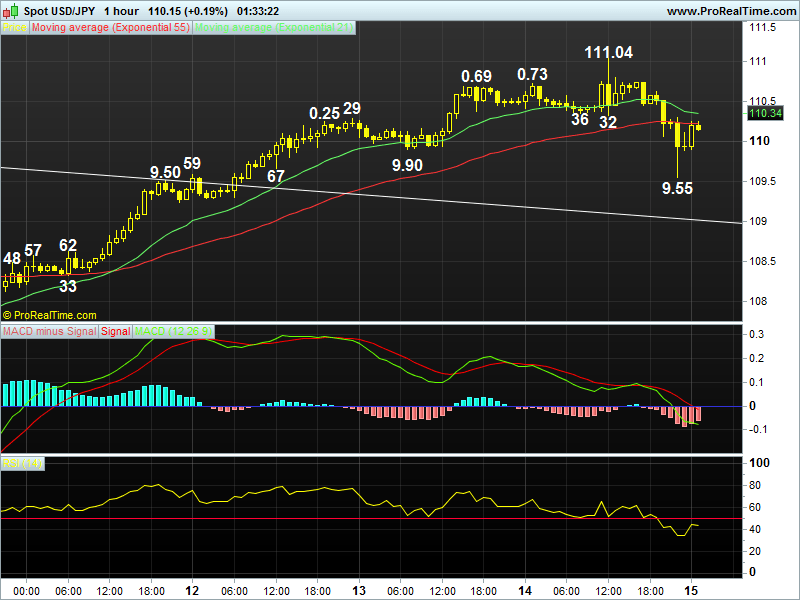
. USD/JPY - 110.15.. Dlr rose abv Wed's 110.69 high to 110.73 in Asia Thur n retreated to 110.36 in Europe b4 jumping to 111.04 on upbeat US CPI b4 falling to 110.07 near NY close on profit taking, then spiked lower to 109.55 in Aust.
. On the bigger picture, despite dlr's resumption of MT 'erratic' decline fm 118.66 (Dec 2016) to retrace early uptrend fm 2016 29-month bottom at 99.00 to 107.32 last Fri, this week's stronger-than-expected rally on rising U.S. yields to a 1-month high of 111.04 y'day signals aforesaid fall has made a low there as this lvl was accompanied by 'bullish converging signals' on the daily indicators n choppy consolidation with upside bias is seen for further headway to 111.65 (being a minimum 38.2% r) but 112.20 res would cap upside. Therefore, buying dlr on dips is favoured n only below 108.74 (61.8% r of 107.32-111.04) may risk weakness twd 108.33 b4 prospect of another rise.
. Today, dlr's selloff fm 111.04 after failure to penetrate 111.05 (Aug high) confirms 1st leg of correction fm 107.32 has ended as this lvl was accompanied by 'bearish divergences' on the hourly indicators n retracement twd 109. 24 is likely but 108.74 would contain weakness. Only abv 110.73 risks 111.04/05.
Author

AceTrader Team
AceTrader
Led by world-renowned technical analyst Wilson Leung, we have a team of 7 analysts monitoring the market and updating our recommendations and commentaries 24 hours a day.
More from AceTrader Team


