Daily Technical Outlook on Major -USD/JPY

Last Update At 18 Jul 2017 00:07GMT
Trend Daily Chart
Sideways
Daily Indicators
Turning down
21 HR EMA
112.62
55 HR EMA
112.78
Trend Hourly Chart
Sideways
Hourly Indicators
Turning up
13 HR RSI
48
14 HR DMI
-ve
Daily Analysis
Consolidation b4 one more fall
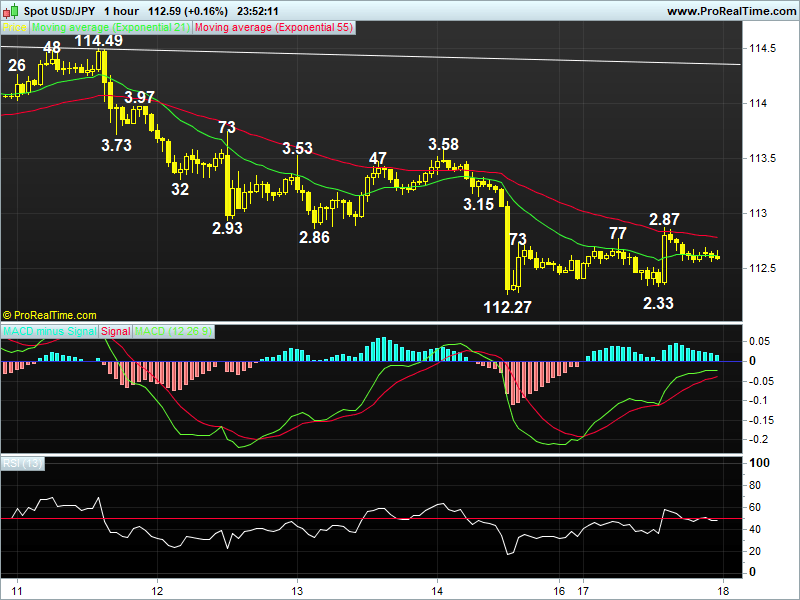
Resistance
113.58 - Last Fri's high
113.15 - Last Fri's European low (now sup)
112.86 - Last Thur's low (now res)
Support
112.27 - Last Fri's low
111.95 - This month's low (3rd)
111.73 - Jun 30 low
. USD/JPY - 112.59. Dlr traded narrowly on Mon in Asia due to a holiday in Japan. Price met renewed selling at 112.77 n later fell to 112.33 in NY morning but then rebounded on cross-selling in yen to 112.87 b4 easing.
. Let's look at the bigger picture 1st, dlr's rise fm 2016 bottom of 99.00 (Jun) to 118.66 (mid-Dec) confirms MT fall fm 2015 near 13-year peak at 125.86 has ended there. Despite subsequent erratic decline to 108.13 in mid-Apr, dlr's rally to 114.49 last Tue confirms said move fm 108.13 has resumed n would head twd 115.51 (Mar top) later this month. Having said that, subsequent stronger- than-expected cross inspired fall to 112.27 last Fri signals temporary top has been made n choppy trading with downside bias is seen for a retracement to chart obj. at 111.73, however, reckon 110.56 (61.8% r fm 108.13) would hold. On the upside, a daily close abv 113.58 signals pullback over n yields 114.49 again.
. Today, dlr's rebound fm 112.33 to 112.87 suggests range trading abv 112. 27 low would continue, as long as 113.00 holds, said decline fm 114.49 would resume, however, 'bullish convergences' would keep price abv 111.73 sup. Only a daily close abv 113.00 would risk stronger retracement twd 113.53/58 b4 down.
Interested in USD/JPY technicals? Check out the key levels
Author

AceTrader Team
AceTrader
Led by world-renowned technical analyst Wilson Leung, we have a team of 7 analysts monitoring the market and updating our recommendations and commentaries 24 hours a day.


