Daily Technical and Trading Outlook - USD/JPY


Last Update At 18 May 2017 00:49GMT
Trend Daily Chart
Sideways
Daily Indicators
Turning down
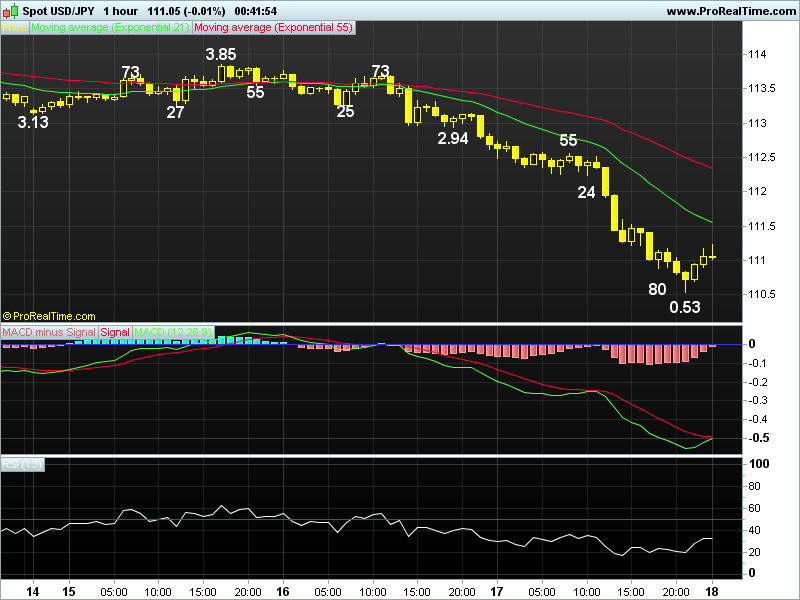
21 HR EMA
111.56
55 HR EMA
112.334
Trend Hourly Chart
Down
Hourly Indicators
Rising fm o/s
13 HR RSI
32
14 HR DMI
-ve
Daily Analysis
Consolidation b4 one more fall
Resistance
112.24 - Y'day's Euoepan morning low (now rs)
111.60 -Hourly chart
111.307 - 38.2% r of 112.55-110.53
Support
110.53 - Intra-day low
110.11 - Mar low (27th)
109.60 - pr 24 low
-
USD/JPY - 111.07.. The pair tumbled in Asian, European n NY sessions on Wed as market reacted negatively to continued U.S. political turmoil. Price fell fm 113.14 (AUS) to 112.24 at European midday n then to 111.80 near NY close.
-
On the bigger picture, dlr's rally fm 2016 bottom of 99.00 (Jun) to a 10-1/2 month high of 118.66 (mid-Dec) confirms MT fall fm 2015 near 13-year peak at 125.86 has formed a low there. Despite subsequent weakness to 108.13 in mid-Apr, dlr's cross-inspired strg rise to 114.37 last Wed suggests aforesaid fall fm 118.66 has ended there. Having said that, this week's selloff due to safe haven buying of yen on political turmoil at the White House suggests downside bias remains for weakness to 110.11, however, as long as pivotal sup at 109.60 holds, another leg of upmove may be seen in Jun. Abv 113.13 signals pullback is over n revive previous bullish prospect of another rise twd 114.37.
-
Today, despite initial weakness to 110.53 in thin Australian trading, dlr's strg bounce to 111.23 in Asia suggests consolidation is in store b4 prospect of marginal fall, as hourly indicators would display minor 'bullish convergences' on next decline, 110.00 may hold. Only abv 112.24 signals low made.
Interested in USD/JPY technicals? Check out the key levels
Author

AceTrader Team
AceTrader
Led by world-renowned technical analyst Wilson Leung, we have a team of 7 analysts monitoring the market and updating our recommendations and commentaries 24 hours a day.


