Crude Oil: Maturing Elliott Wave pattern

Executive summary
- Crude oil has been declining since June in a final terminal wave.
- Crude oil appears to be nearing the end of its 2-year ending diagonal pattern.
- Downside targets are between $51.77 – 57.38.
Crude oil continues to drift lower as market participants anticipate a weaker economy. The downside trend is mature and nearing completion.
Current Elliott Wave analysis
We are tracking a large ending diagonal pattern in Crude oil that began 2 years ago in September 2023. The ending diagonal is one of the five basic Elliott wave patterns and is shaped like a falling wedge.
We previously forecasted this pattern in the Q4 Commodities forecast as well as a follow up on it slipping lower.
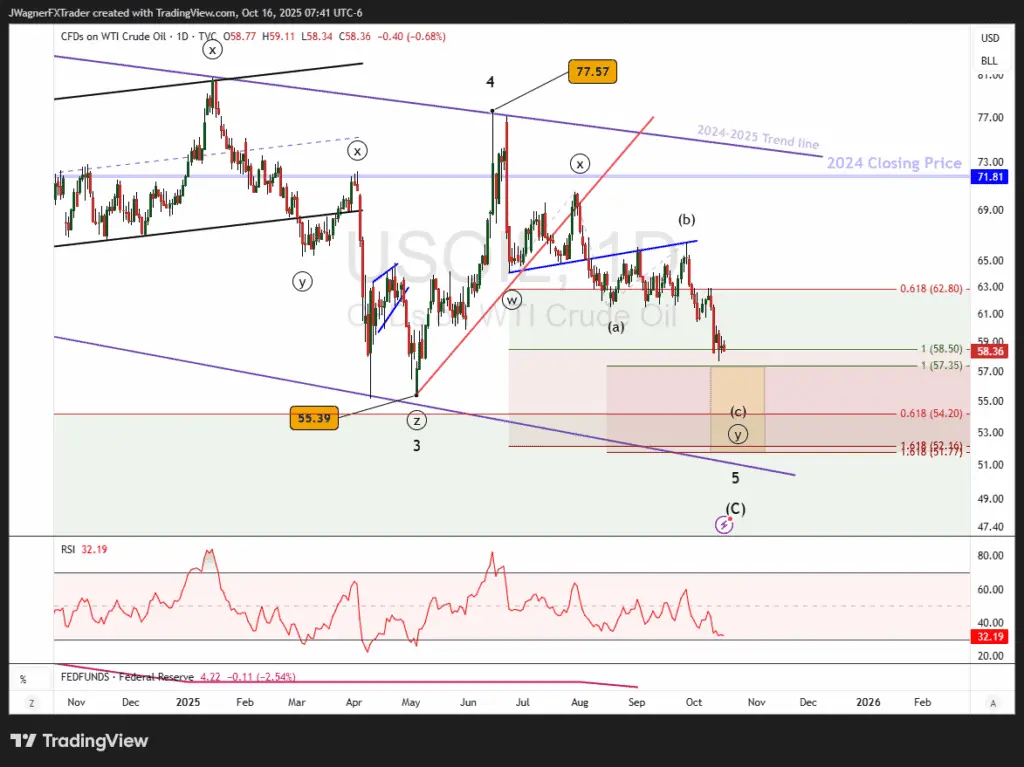
It appears Crude oil is over half-way through the last wave, wave 5 of the ending diagonal. Wave 5 appears to be developing as a ((w))-((x))-((y)) double zigzag. Prices are in the ((y)) wave of the pattern.
Wave ((y)), being a zigzag, would subdivide as (a)-(b)-(c). I suspect the pattern is within wave (c) and is approaching the ending wave at multiple degrees of trend.
The previous potential pivot point we’ve identified is between $51.77 – $57.38 (yellow box). That zone is developed using the Fibonacci extension tool.
On Tuesday, Crude oil prices reached $57.68, just above the price zone we are targeting. Additionally, the wave count appears incomplete and counts best with one or two more jabs lower.
The bullish reversal is approaching, but the final stages of this bearish trend need to count off.
The next bullish trend is anticipated to be quite large. It may be driven by high inflation or constrained supply as a result of war. Crude oil experts are hinting that no new wells are being drilled because the price is too cheap and the tariffs make them unprofitable.
Crude oil, priced in ounces per gold, is at historic lows and only previously seen in 2020 which lead to an aggressive bounce in oil.
Above is 42-year price history on the price of crude oil compared to gold.
Bottom line
Crude oil appears to be nearing the end of a large ending diagonal pattern that began September 2023. We estimate a downside target, using Elliott wave principles, to be $51.77 – 57.38
If Crude oil rallies above $63, then we’ll begin to consider a MAJOR bottom may be in place.
Author

Zorrays Junaid
Alchemy Markets
Zorrays Junaid has extensive combined experience in the financial markets as a portfolio manager and trading coach. More recently, he is an Analyst with Alchemy Markets, and has contributed to DailyFX and Elliott Wave Forecast in the past.


