|

CRB index reversal: Impact on commodities, inflation, and the Dollar [Video]

It’s been some time since we last looked at the Thomson Reuters CRB Index, a key indicator for tracking commodity performance and gauging inflation. With inflation softening recently, it’s not surprising that the CRB Index is also reversing. The chart shows a three-wave rally from the 2023 lows, which suggests a corrective movement in an ABC formation, as identified in Elliott Wave theory.

When a correction like this concludes, the next move typically retraces the previous rally. Looking at the CRB Index, we expect prices to move even lower, possibly down to 241. This decline could be further driven by falling crude oil prices, especially if OPEC increases supply as recently announced.

Some may wonder how this will impact the USD. Currently, the correlation is that lower commodities lead to lower CPI, which in turn suggests a lower USD due to expectations of Fed rate cuts. Until the Fed cuts rates a few times, the correlation between a lower CRB and a lower USD could remain in play due to falling US yields. However, once rate cuts are nearing their end, that’s when the dollar may find a bottom.

Chart

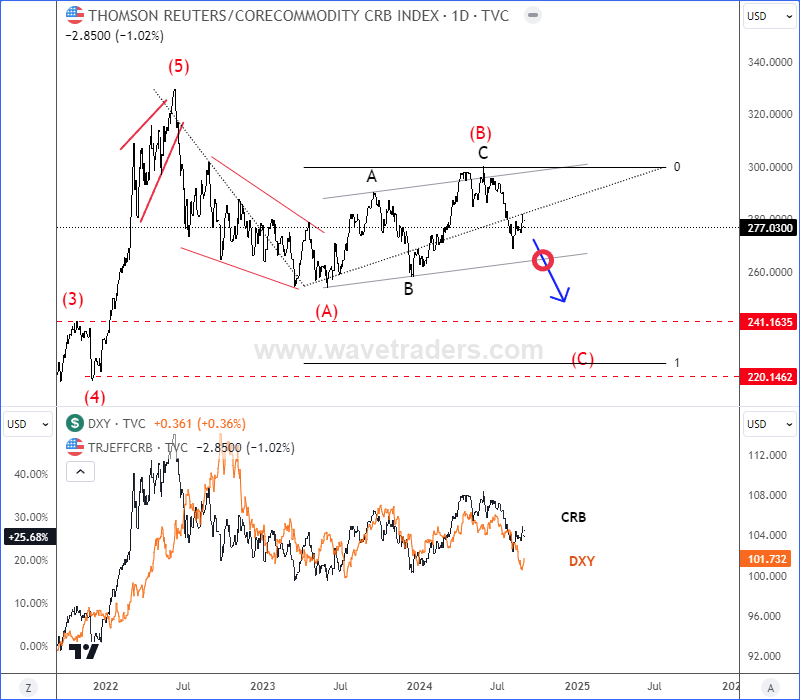
CRB vs DXY daily chart

If you are interested in detailed view and more analysis like this, you may want to watch below our latest recording of a live webinar streamed yesterday on Monday September 02 2024:


Get Full Access To Our Premium Elliott Wave Analysis For 14 Days. Click here.


Get Full Access To Our Premium Elliott Wave Analysis For 14 Days. Click here.

Author

Gregor Horvat

Gregor Horvat

Wavetraders

Experience Grega is based in Slovenia and has been in the Forex market since 2003.

More from Gregor Horvat
Share:

Markets move fast. We move first.

Orange Juice Newsletter brings you expert driven insights - not headlines. Every day on your inbox.

By subscribing you agree to our Terms and conditions.

Editor's Picks

EUR/USD clings to small gains near 1.1750

Following a short-lasting correction in the early European session, EUR/USD regains its traction and clings to moderate gains at around 1.1750 on Monday. Nevertheless, the pair's volatility remains low, with investors awaiting this weeks key data releases from the US and the ECB policy announcements.

GBP/USD edges higher toward 1.3400 ahead of US data and BoE

GBP/USD reverses its direction and advances toward 1.3400 following a drop to the 1.3350 area earlier in the day. The US Dollar struggles to gather recovery momentum as markets await Tuesday's Nonfarm Payrolls data, while the Pound Sterling holds steady ahead of the BoE policy announcements later in the week.

Gold stuck around $4,300 as markets turn cautious

Gold loses its bullish momentum and retreats below $4,350 after testing this level earlier on Monday. XAU/USD, however, stays in positive territory as the US Dollar remains on the back foot on growing expectations for a dovish Fed policy outlook next year.

Solana consolidates as spot ETF inflows near $1 billion signal institutional dip-buying

Solana price hovers above $131 at the time of writing on Monday, nearing the upper boundary of a falling wedge pattern, awaiting a decisive breakout. On the institutional side, demand for spot Solana Exchange-Traded Funds remained firm, pushing total assets under management to nearly $1 billion since launch. 

Big week ends with big doubts

The S&P 500 continued to push higher yesterday as the US 2-year yield wavered around the 3.50% mark following a Federal Reserve (Fed) rate cut earlier this week that was ultimately perceived as not that hawkish after all. The cut is especially boosting the non-tech pockets of the market.

Solana Price Forecast: SOL consolidates as spot ETF inflows near $1 billion signal institutional dip-buying

Solana (SOL) price hovers above $131 at the time of writing on Monday, nearing the upper boundary of a falling wedge pattern, awaiting a decisive breakout.