Consolidation ending as dollar support breaks down again

Market Overview
The long term trend for the dollar is negative and once more its support seem to be breaking down which is impacting across financial markets. The fact that there seems to be little the dollar bulls can do to affect the market, even during periods of consolidation, just shows what a parlous place being long of the dollar is right now. The market may be record long of the euro (on CFTC futures positions) but that is not even allowing the contrarians a sniff. Strong data out of the Eurozone continues to flood through, with Eurozone Consumer Confidence hitting multi-year highs yesterday being the latest in a line of encouraging news ahead of the latest ECB monetary policy meeting tomorrow. After a weekend of constructive rhetoric over Brexit we see Cable back above $1.4000 for the first time since 24th June 2016, whilst the yen has strengthened in the wake of the Bank of Japan. Everything is going against the dollar at the moment and this is being reflected on the charts. An oversold dollar rally seems to be not forthcoming. However it will be interesting to see how markets react to potential trade wars bubbling up, after Donald Trump slapped tariffs on solar cells and washing machines into the US. Under his “America First” mantra, Trump is looking to reduce the size of the US trade deficit, something that plays on a weaker dollar.

Wall Street had a quiet session but the S&P 500 still managed to gain +0.2% at 2839. Asian markets were mixed (Nikkei -0.8%) with European markets also mixed in early moves. In forex, the dollar is under pressure across the major pairs again, with little standout performer. In commodities, the dollar weakness continues to push gold higher by a couple of dollars, whilst oil is flat after the API inventories yesterday showed a surprising build in crude oil stocks.
There may not be any really major tier one data due today, there is a clutch of announcements which could drive volatility for traders. The Eurozone flash PMIs are at 0900GMT and are expected to remain strong but slip very slightly from last month with Manufacturing back to 60.3 (from 60.6), Services to 56.4 (form 56.6) and the Composite to 57.9 from 58.0. After UK inflation seemed to be rolling over last week focus of the UK employment data at 0930GMT will not be on Unemployment which is expected to remain at 4.3%. Traders will be looking more at the UK Average Weekly Earnings Growth (ex bonus) which are expected to remain at +2.3%. In the afternoon, the US flash PMIs at 1445GMT are expected to show Manufacturing remaining at 55.0 but Services are expected to pick up to 54.0 (52.4 last month). The Existing Home Sales are at 1500GMT and are expected to drop by around 2% to 5.7m (from 5.81m last month). The EIA Oil Inventories have been showing sharp drawdowns for crude stocks in recent weeks and this is expected to continue at -2.5m barrels (-6.9m last week), with distillates at -1.5m (-3.9m last week) whilst gasoline is expected to build again at +2.5m (+3.6m last week). Finally late in the day the New Zealand CPI data is at 2145GMT and is expected to remain at +1.9% for the year.
Chart of the Day – AUD/JPY
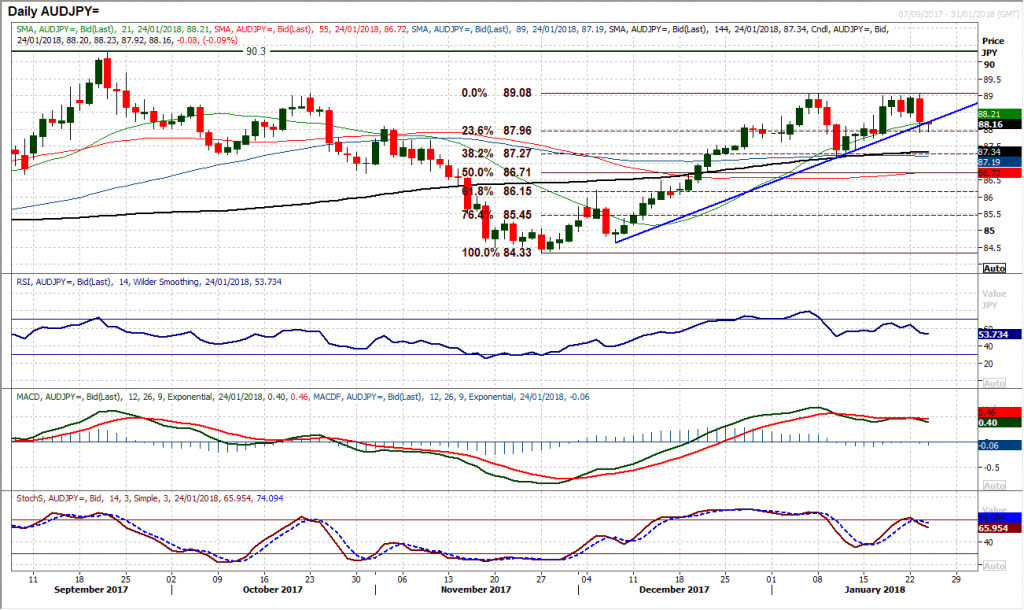
Another big one day reversal pattern at the January high could now be set to usher in a corrective move on Aussie/Yen. A “bearish engulfing” candlestick pattern was left as the market failed at the 89.08 resistance only to drop to a one week low. This now shifts sentiment into reverse once more with the momentum indicators on the daily chart giving a series of negative signals. The RSI having failed to move back above 70 has dropped back below 60, whilst more considerable has been the “bear kiss” on the MACD lines having recently crossed lower. Furthermore, the Stochastics have also crossed back lower again. The Fibonacci levels of the 84.33/89.08 rally have been important recently and the market bounced off 23.6% Fib yesterday (at 87.96) as a first line of support. However if the downward pressure continues to build as ait has done in the past 24 hours then a breach of 23.6% could be seen, which would open 38.2% Fib at 87.2, which coincides with the January low. The hourly chart shows initial resistance at 88.40 which is a neckline of a breakdown and 88.40/88.60 is now a near term sell-zone.
EUR/USD
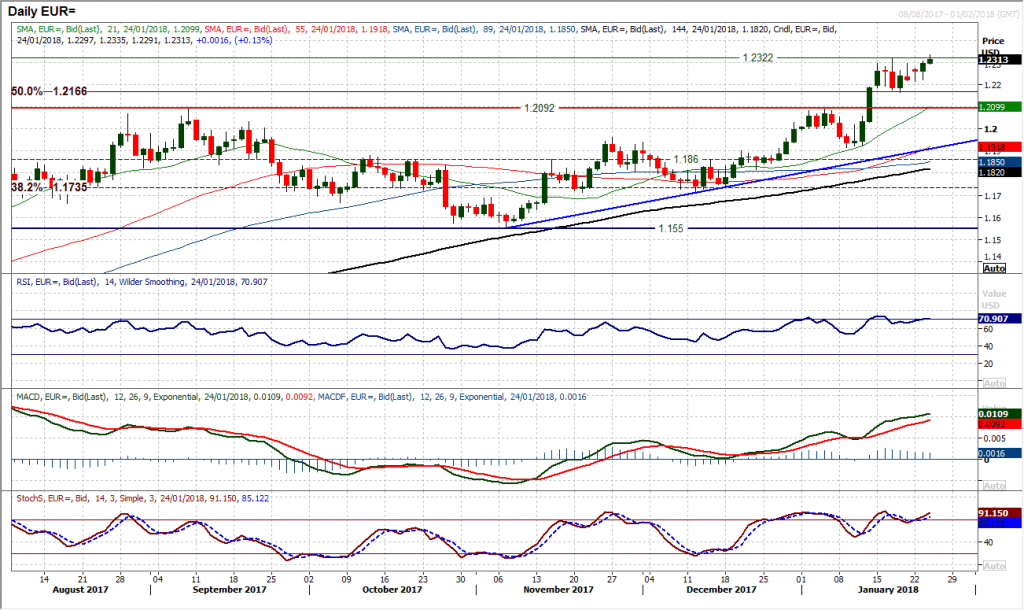
After a period of consolidation, the euro is breaking higher again. The break to new three year highs is coming ahead of the ECB meeting tomorrow, helped by strong Eurozone Consumer Confidence data and a renewed dollar weakness. With the market having been in a range for the past week, a close above $1.2320 would now imply around 160 pips of additional upside, whilst the next real resistance does not come in until $1.2600. Momentum indicators retain a strong configuration and it is clear that with a succession of higher daily lows now building, intraday weakness is being bought into. The hourly chart is now positively configured with support at $1.2220/$1.2275. The main caveat would be the volatility that is likely to come with tomorrow’s ECB meeting press conference.
GBP/USD
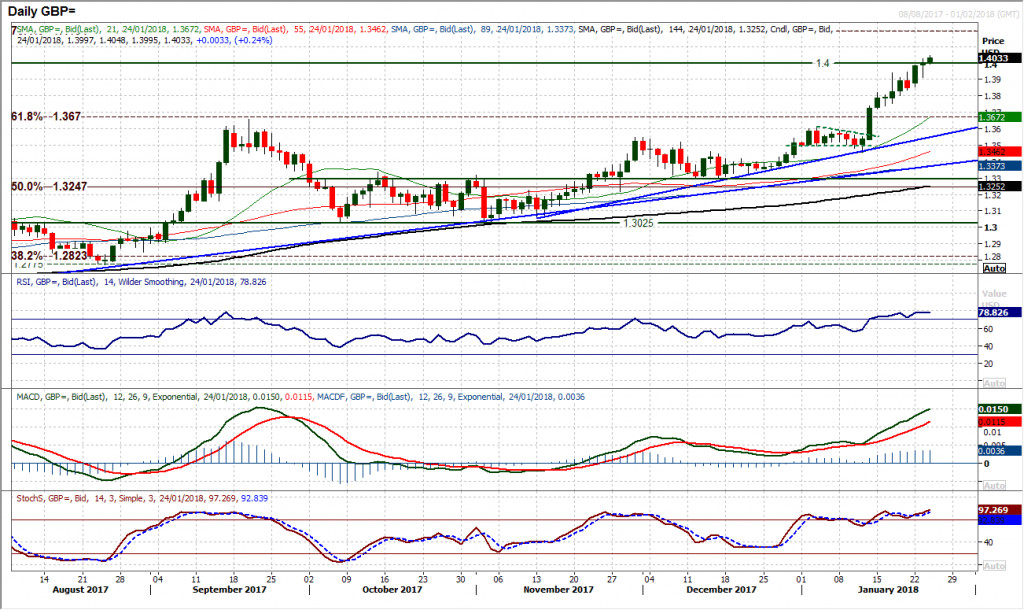
The bull run higher on Cable is showing little sign of abating as another positive session has pulled sterling to the $1.4000 psychological level and subsequently above today. The bulls are on a run and seemingly the RSI in the high 70s simply reflects the strength of the trend rather than a potential overstretched market. Runs like these can go for weeks, and the RSI on Cable has been above 7 now for coming up to two weeks. However with the MACD and Stochastics lines running higher, there is little suggestion that the bulls are losing faith quite yet. This is reflected on the hourly chart which sees strong configuration across momentum, whilst intraday weakness is being consistently bought into. A string of higher lows are being left now with the latest at $1.3915 above $1.3825 and $1.3740. A close above $1.4000 today seems increasingly likely, with the way open for $1.4200/$1.4300 as the market continues to unwind the Brexit sell-off. Corrections remain a chance to buy.
USD/JPY
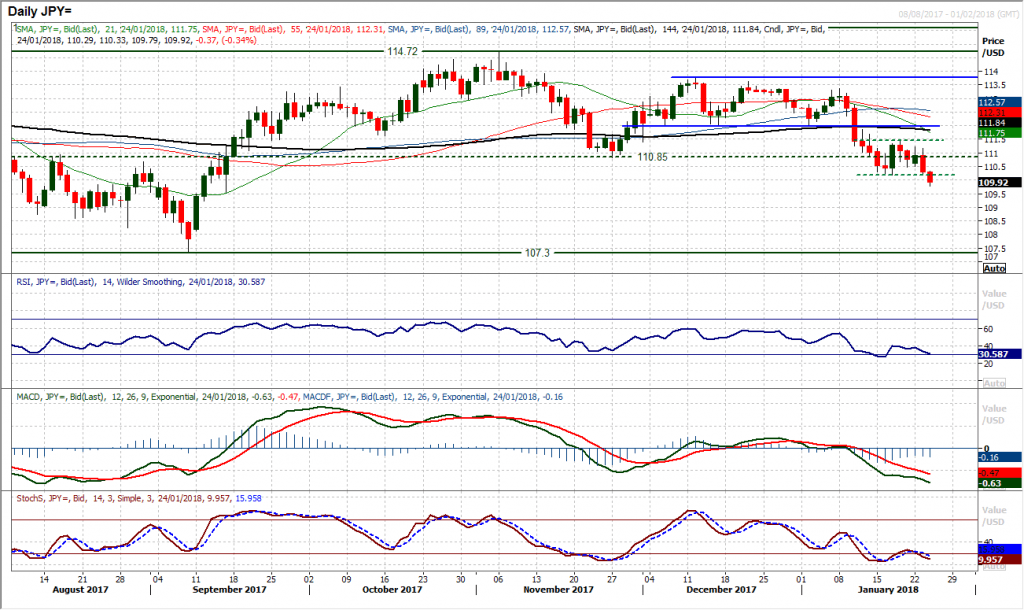
A decisive downside break takes Dollar/Yen to its lowest since September and confirms the return of the dollar selling pressure. The support at 110.20 has been breached today as the market now continues its move lower. The next support is at 109.55 however there is little support of any significance until the old key lows of 2017 where the market hit 107.30 in September. Momentum indicators are once more in significantly negative configuration with MACD and Stochastics turning lower and now intraday gains are being sold into. The old supports of 110.20/110.50 with the range of the past week now become resistance and overhead supply, making them a near term sell-zone. The hourly chart is a touch stretched near term and any move to unwind will be seen as an opportunity. Resistance at 111.50 is now key.
Gold
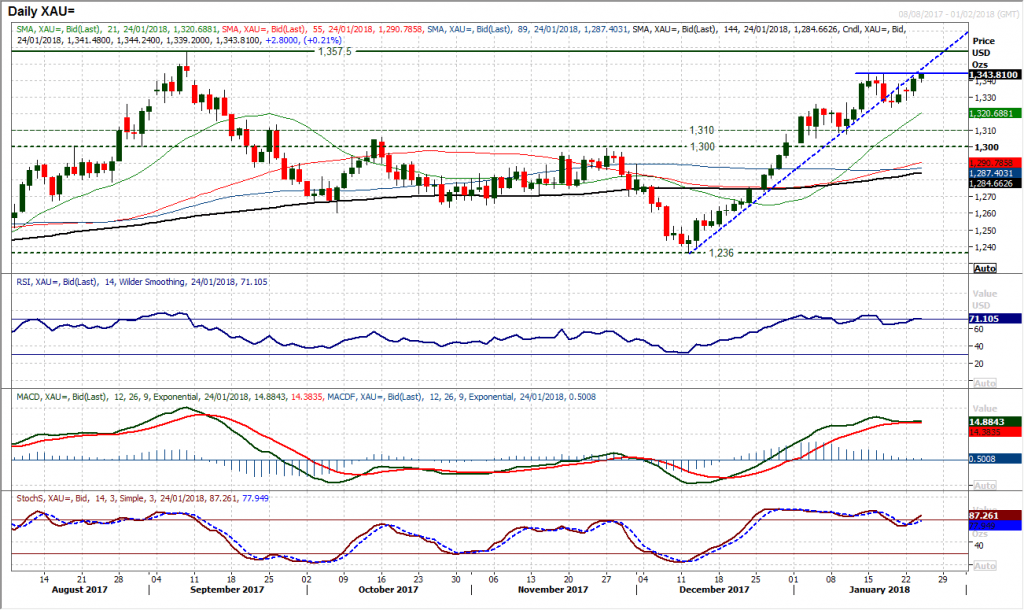
Gold is looking to breakout again. The resistance at $1344 is being tested again today as the bulls seem to have regained some of their control back. A closing break above $1344 would then re-open $1357.50 which is the high from September but also marks the beginning of a band of major resistance $1357/$1375 from 2016/2017. Having unwound a week ago, the market is now looking to leave $1325 as a basis of key support as the run higher resumes. Momentum is positively configured, but there is still a sense that the bulls are not quite as strong as they have been previously, whilst it is noticeable that the underside of the old uptrend is also playing a role in capping the daily gains. For now though the bulls seem to be back in the driving seat. The hourly hart shows initial support at $1331/$1338 with intraday weakness seen as a chance to buy.
WTI Oil
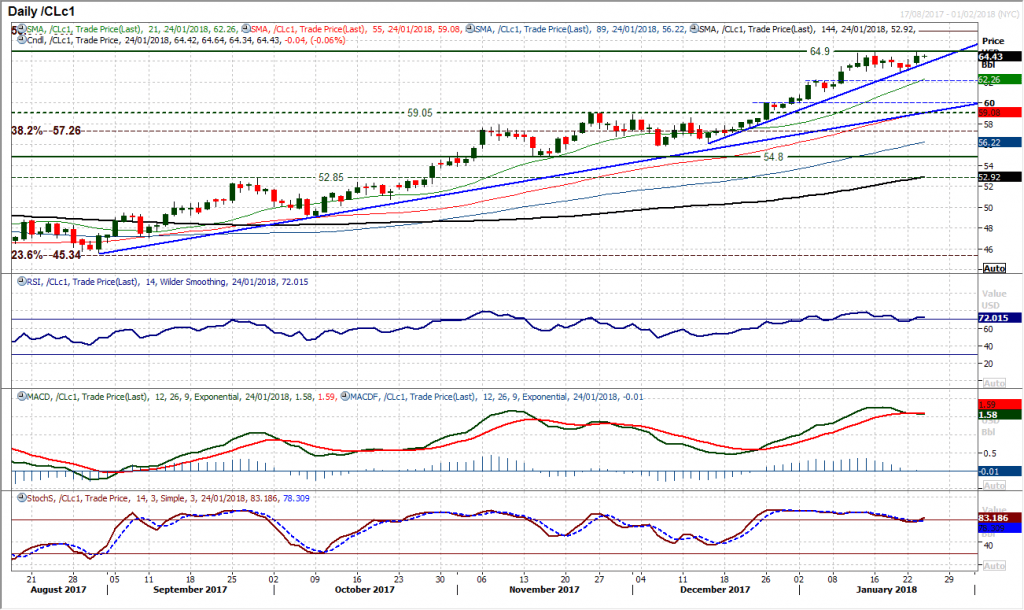
After a week of a mild corrective slip, the first day of the new contract was strong for WTI with the bulls having posted a strong candle. A close above $64.35 seems to now have re-opened the recent high at $64.90, but it is important that the support of the now six week uptrend is held (currently around $63.75) and the support at $62.85 is bolstered. A slip back on the momentum indicators is quickly now looking set to turn more positive again and the MACD lines could be key to this. The Stochastics have turned up but the MACD lines are at a crossroads now. If there is a “bull kiss” rather than a bear cross then the outlook will be seen as strong again for further gains. The RSI is still buzzing round the 70 level and is still positively configured. The hourly chart shows the configuration also turning more positive again. Holding above a near term pivot around $63.60/$63.75 will maintain the improving outlook once more.
Dow Jones Industrial Average
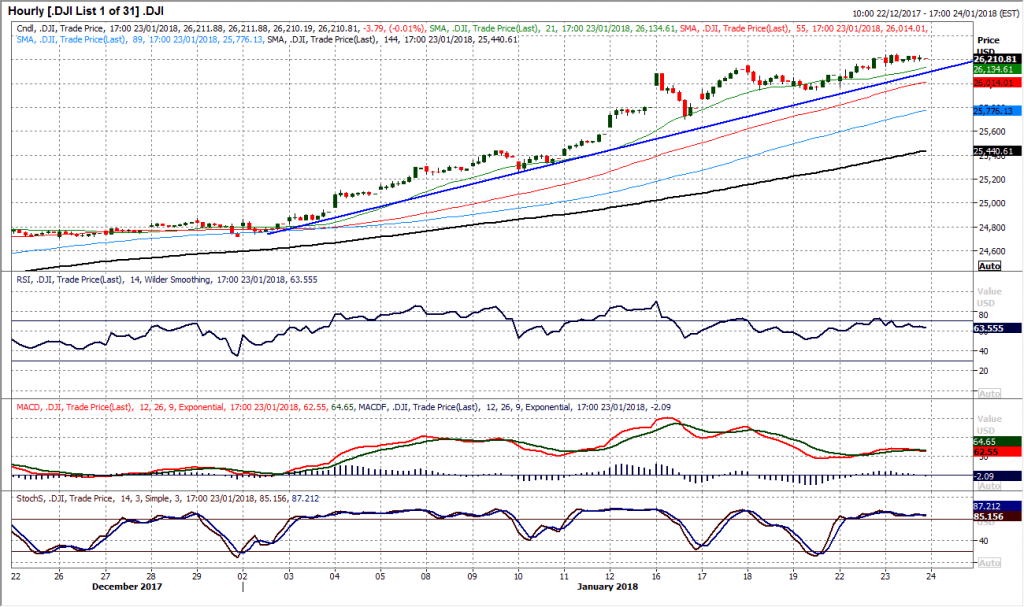
A breakout and then a consolidation. The Wall Street bulls took a mini breather yesterday as the market just consolidated yet another move into new all-time highs the day before. On the Dow, a small daily range of just over 100 ticks and all but a doji candle. Despite the caution that should come with a doji, there is nothing on the daily chart to suggest that the market is set to slow its advance in the coming days. Intraday weakness continues to be bought into and this is likely just to be a rest day. The hourly chart remains in its latest uptrend which is one that dates back to the beginning of January with the rising 21 hour moving average doing a decent job flanking the move higher. Momentum indicators remain in strong configuration but on the hourly chart perhaps it should be worth nothing that a potential loss of impetus on hourly RSI and MACD lines, with the bull run would be seen if the RSI dropped below 50 and or the MACD lines dropped below neutral. In the absence of this though there seems to be little to worry for the bulls. There is now a band of support forming 25,950/26,153.
Author

Richard Perry
Independent Analyst


