Commodities Weekly: Gold shines on safe haven flows
Deteriorating trade relations between the US and China are raising doubts about global growth and boosting the appeal of safe haven assets. US Treasuries, gold and the Japanese yen are sought after, while crude oil has come under pressure.
Precious metals
GOLD touched the highest in more than three months last night as safe haven flows into the yellow metal continue. The metal looks poised for the fifth daily gain in a row, the best run since January. Gold rallied last month for the first time in four months, has risen another 1.6% so far this month and is nearing the 78.6% Fibonacci retracement of the drop from February to April at 1,329.53.
Gold Daily Chart
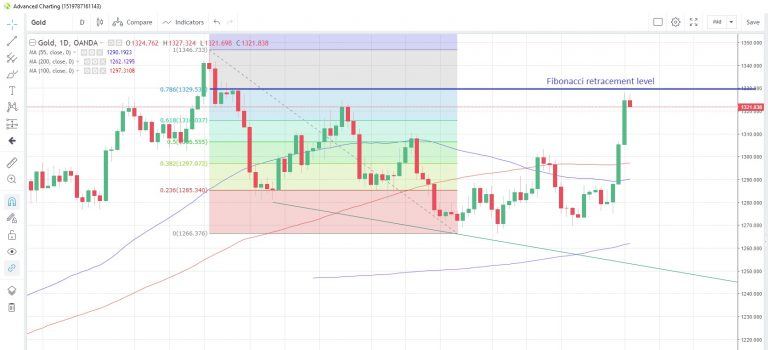
Source: OANDA fxTrade
The lack of upward momentum last month saw speculative investors reducing their net long positions for a second consecutive week in the week to May 28, according to the latest data snapshot from CFTC.
In contrast, SILVER continues to underperform as it slowly attempts a rebound from the 2019 lows hit a week ago. It is edging toward the 200-day moving average resistance at 14.9104 while the 55-day moving average sits at 14.9168. Silver is now at 14.8001. The gold/silver (Mint) ratio has risen to record highs this week amid gold’s better bid tone. Speculative investors are not so enthusiastic about silver, increasing net short positions for the last four reporting weeks, according to CFTC. Net shorts are now at the highest since September last year.
PLATINUM saw the biggest one-day gain in two months yesterday as the US dollar retreated. The rebound came as the metal posted the biggest monthly loss since August 2016 last month. The precious metal is now at 823.17 and looks poised to test the 200-day moving average at 828.86 for the first time since May 17.
Speculative accounts reduced net long position for a fourth consecutive week, latest data to May 28 from CFTC shows. They are now at the lowest level since the week of February 19.
PALLADIUM is little changed on the week as it continues to consolidate the big decline from record highs in March. Palladium is now at 1,330.65 sandwiched between 200-day moving average support at 1,270.46 and 55-day moving average resistance at 1,387.82. In contrast to platinum, speculative accounts increased their net long positions for a second straight week to May 28, CFTC data shows, and they are now at the highest since April 30.
Base metals
Weakening global growth prospects continue to pressure COPPER prices with a protracted, escalating US-China trade war implying slower global growth and hence slackening demand for industrial metals. Potential supply-side issues were unable to give the base metal a lift after Chile’s state-owned Codelco temporarily halted copper production at its biggest mine which produced almost 94,000 tons of copper in the first quarter.
Speculative investors extended the recent net selling spree into a sixth week and net short positions are at their most bearish since the week of January 22
Energy
Trade war angst leading to growth concerns and the implications for demand are weighing on CRUDE OIL prices, while falling oil prices are subsequently taking their toll on the energy-related counters in the US indices.
Prices have been trending lower since the latter part of April and reached the lowest level since February 11 yesterday. West Texas Intermediate (WTI) is now hovering just above yesterday’s lows at $52.93 per barrel with the 61.8% Fibonacci retracement of the December-April rally at $51.47.
WTI Daily Chart
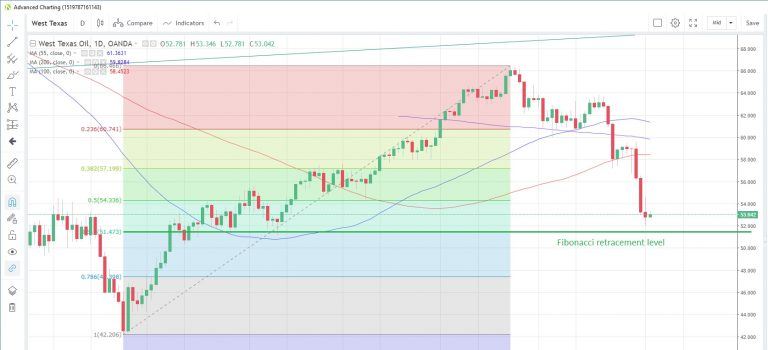
Source: OANDA fxTrade
News that Russia’s output in May had fallen below the target agreed with OPEC+ has done little to support crude oil prices. Russia’s Energy Ministry reported that output was down 1.1% from the previous month to 11.11 million barrels per day. There were also reports that Saudi Arabia’s production cuts were deeper than what had been agreed.
CFTC data shows that net long non-commercial futures positions were trimmed for a fifth straight week to May 28 and they are now at the lowest since the week of March 19
NATURAL GAS prices fell to the lowest since June 2016 yesterday and Gas could be on track for the seventh monthly loss in a row. In the near term, the 55-day moving average is acting as a tough resistance point, and it has capped prices on a closing basis since December 18 last year. Traders continue to attempt to gauge demand for natural gas, with warmer weather in the US South balancing cooler weather elsewhere in the June 8-12 period, according to recent weather reports.
Bearish bets against the commodity are at their highest since August last year, according to data showing net non-commercial futures position as at May 28 from CFTC.
Agriculturals
WHEAT posted the biggest monthly gain in almost two years last month as weather-related supply-side issues dominated headlines. Recent reports out of Moscow indicated that Russia’s 2019/20 crop harvest estimate would be cut 1%, while persistent rains in the US wheat belt also raised concerns about the harvest outlook.
Wheat prices jumped almost 19% from 16-month lows last month and the commodity has extended those gains so far this month to reach the highest since February. Speculative accounts were net buyers for a fourth straight week to May 28, CFTC data shows, and net short positions have now been trimmed to the lowest level since the week of February 12.
SUGAR prices are also extending gains from recent seven-month lows and yesterday closed above the 200-day moving average for the first time since April 30. The 200-day moving average is at 0.1202 and sugar closed at 0.12047 yesterday. Speculative investors still remain bearish on the commodity, increasing net short positions for a fifth consecutive week and raising net short positions to the most since September 4.
Sugar Daily Chart
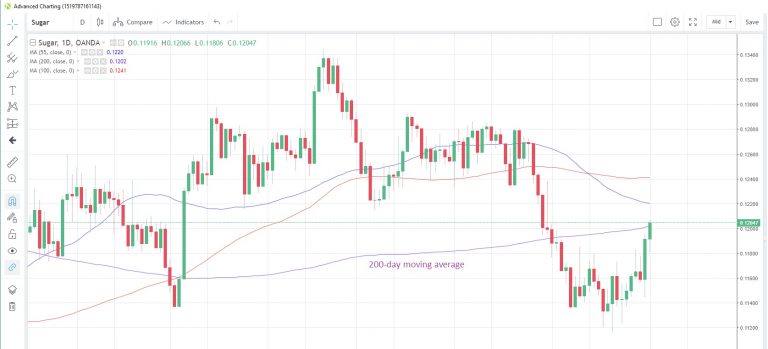
Source: OANDA fxTrade
CORN is consolidating May’s strong upmove, which saw prices rising the most in nearly seven years to hit the highest since June 2016. It’s now at 4.265 after peaking last month at 4.294. The up-move saw some profit-taking among speculative investors as they turned net sellers in the week to May 28 for the first time since the week of March 5.
SOYBEANS are a relative under-performer in the agricultural space as they remain most vulnerable to the deterioration in the US-China trade relations. Prices have managed to climb to 2-1/2 week highs of 8.851 however, and look set to close above the 55-week moving average at 8.7706 for the first time in a year.
Speculative accounts reduced net short positions for a second week to May 28 and they are now at their lowest in six weeks, according to CFTC data.
Author

Andrew Robinson
MarketPulse
A seasoned professional with more than 30 years’ experience in foreign exchange, interest rates and commodities, Andrew Robinson is a senior market analyst with OANDA, responsible for providing timely and relevant market commentar


