Commodities Weekly: Gold hits 6-1/2 week high

Next report will be published on January 7th
Precious metals
GOLD looks set to rally for a third consecutive week and has managed to break out of a recent chart pattern on safe-haven buying. Concerns have been raised about the yet-to-be-signed US-China trade deal and fresh Brexit headlines. Speculative investors were well-prepared for the latest up-move as they were net buyers of the commodity in the week to December 17, adding to already net long positions, according to the latest data from CFTC.
The metal has broken above the upper band of the wedge chart pattern that has been in place since September 4, but has yet to break above the 100-day moving average at 1,492.34.
Gold Daily Chart

Source: OANDA fxTrade
SILVER has risen above the 100-day moving average for the first time since November 8, which meant that the gold/silver (Mint) ratio slid to its lowest level in 6-1/2 weeks. Exchange-traded funds (ETFs) cut 42,655 ounces of silver from their holdings in the latest trading session, Bloomberg reported on Monday. Net purchases for the year are still at 84 million ounces. Speculative investors were net buyers of silver for the first time in three weeks in the week to December 17, according to the latest data snapshot from CFTC.
PALLADIUM suffered its biggest weekly drop since July last week amid mild position squaring ahead of the Christmas and New Year holiday season. Speculative investors remain bullish on the metal’s prospects however, after increasing net long positions for a fourth straight week in the week to December 17, according to CFTC data. Net longs are now at the highest since the week of October 29.
Speculative accounts increased net long positions in PLATINUM for a fifth consecutive week, according to the latest report from CFTC, boosting net long positions to levels not seen since August 2016.
Base metals
COPPER is consolidating the gains made in the aftermath of the announcement of the US-China tariff truce, hovering just below the 7-1/2 month high of 2.8168 struck last Friday. Talk that China is considering cutting the number of smelters in operation amid decimated margins has also helped boost sentiment for copper.
Speculative investors were net buyers for a third week to December 17, CFTC data show, with net positioning turning long for the first time since the week of April 23.
Energy
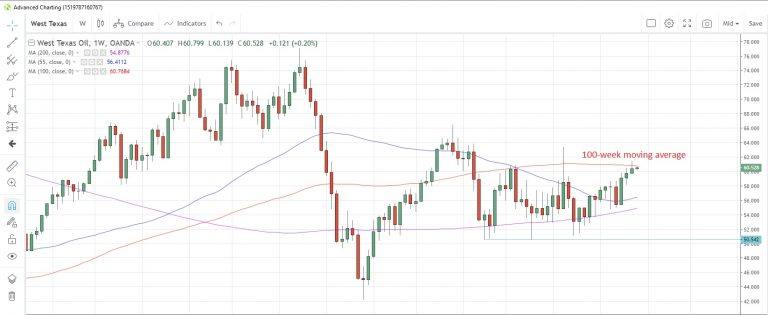
CRUDE OIL prices look set for a third weekly gain in a row, if current levels can be maintained over the Christmas period. West Texas Intermediate (WTI) is currently testing the 100-week moving average at $60.77, a moving average that has capped prices on a closing basis since mid-May.
Crude oil has been rallying as OPEC and its allies introduce production curbs as per the agreement forged earlier this month. Even Iraq, often accused of violating previous agreements, has trimmed its output this month, according to latest market estimates. The number of US oil rigs in production climbed for a second week as at last Friday, and they are now at the highest in seven weeks.
Speculative investors remain bullish on the commodity, boosting net long positions to the highest since the week of April 23, the latest data from CFTC show.
WTI Weekly Chart
Source: OANDA fxTrade
NATURAL GAS prices are hovering above the five-month lows touched earlier this month as milder winter weather across the US is forecast for the December 29 to January 2 period. Gas inventories had fallen by a much larger-than-expected 107 billion cubic feet in the week to December, the weekly data from the Energy Information Administration showed. That was the biggest weekly drawdown since mid-March.
Agriculturals
SOYBEANS jumped to the highest since October 24 yesterday amid reports that China had placed orders for soybeans from US suppliers. The commodity also looks set for its fourth weekly advance this week, the longest stretch since September/October. Meanwhile, adverse weather conditions in Brazil and Argentina risks affecting soybean harvests there.
Speculative investors were net buyers for the first time in seven weeks, according to the latest CFTC report as at December 17.
WHEAT prices have been consolidating this month’s climb to 16-month highs and have fallen for the past four sessions. The commodity looks as if it might break that losing streak today. A Russian grain agency has reported that Russia’s wheat exports are down 14% so far this season to December 17.
Speculative accounts have boosted net long positions to the highest since the week of July 2, according to CFTC data.
CORN prices appear to be struggling to overcome technical resistance at the 200-day moving average of 3.8104. This moving average has been tested numerous times in the past week but remains intact, as it has been since November 6.
Corn Daily Chart
Speculative positioning turned net positive for the first time since the week of September 3, according to the latest data snapshot as at December 17 from CFTC.
Speculative long positions in SUGAR have been lifted to the highest since November 2018, CFTC data show, as prices consolidate near 10-month highs.
Author

Andrew Robinson
MarketPulse
A seasoned professional with more than 30 years’ experience in foreign exchange, interest rates and commodities, Andrew Robinson is a senior market analyst with OANDA, responsible for providing timely and relevant market commentar

















