Commodities: Technical outlook and review

XAU/USD (Gold)
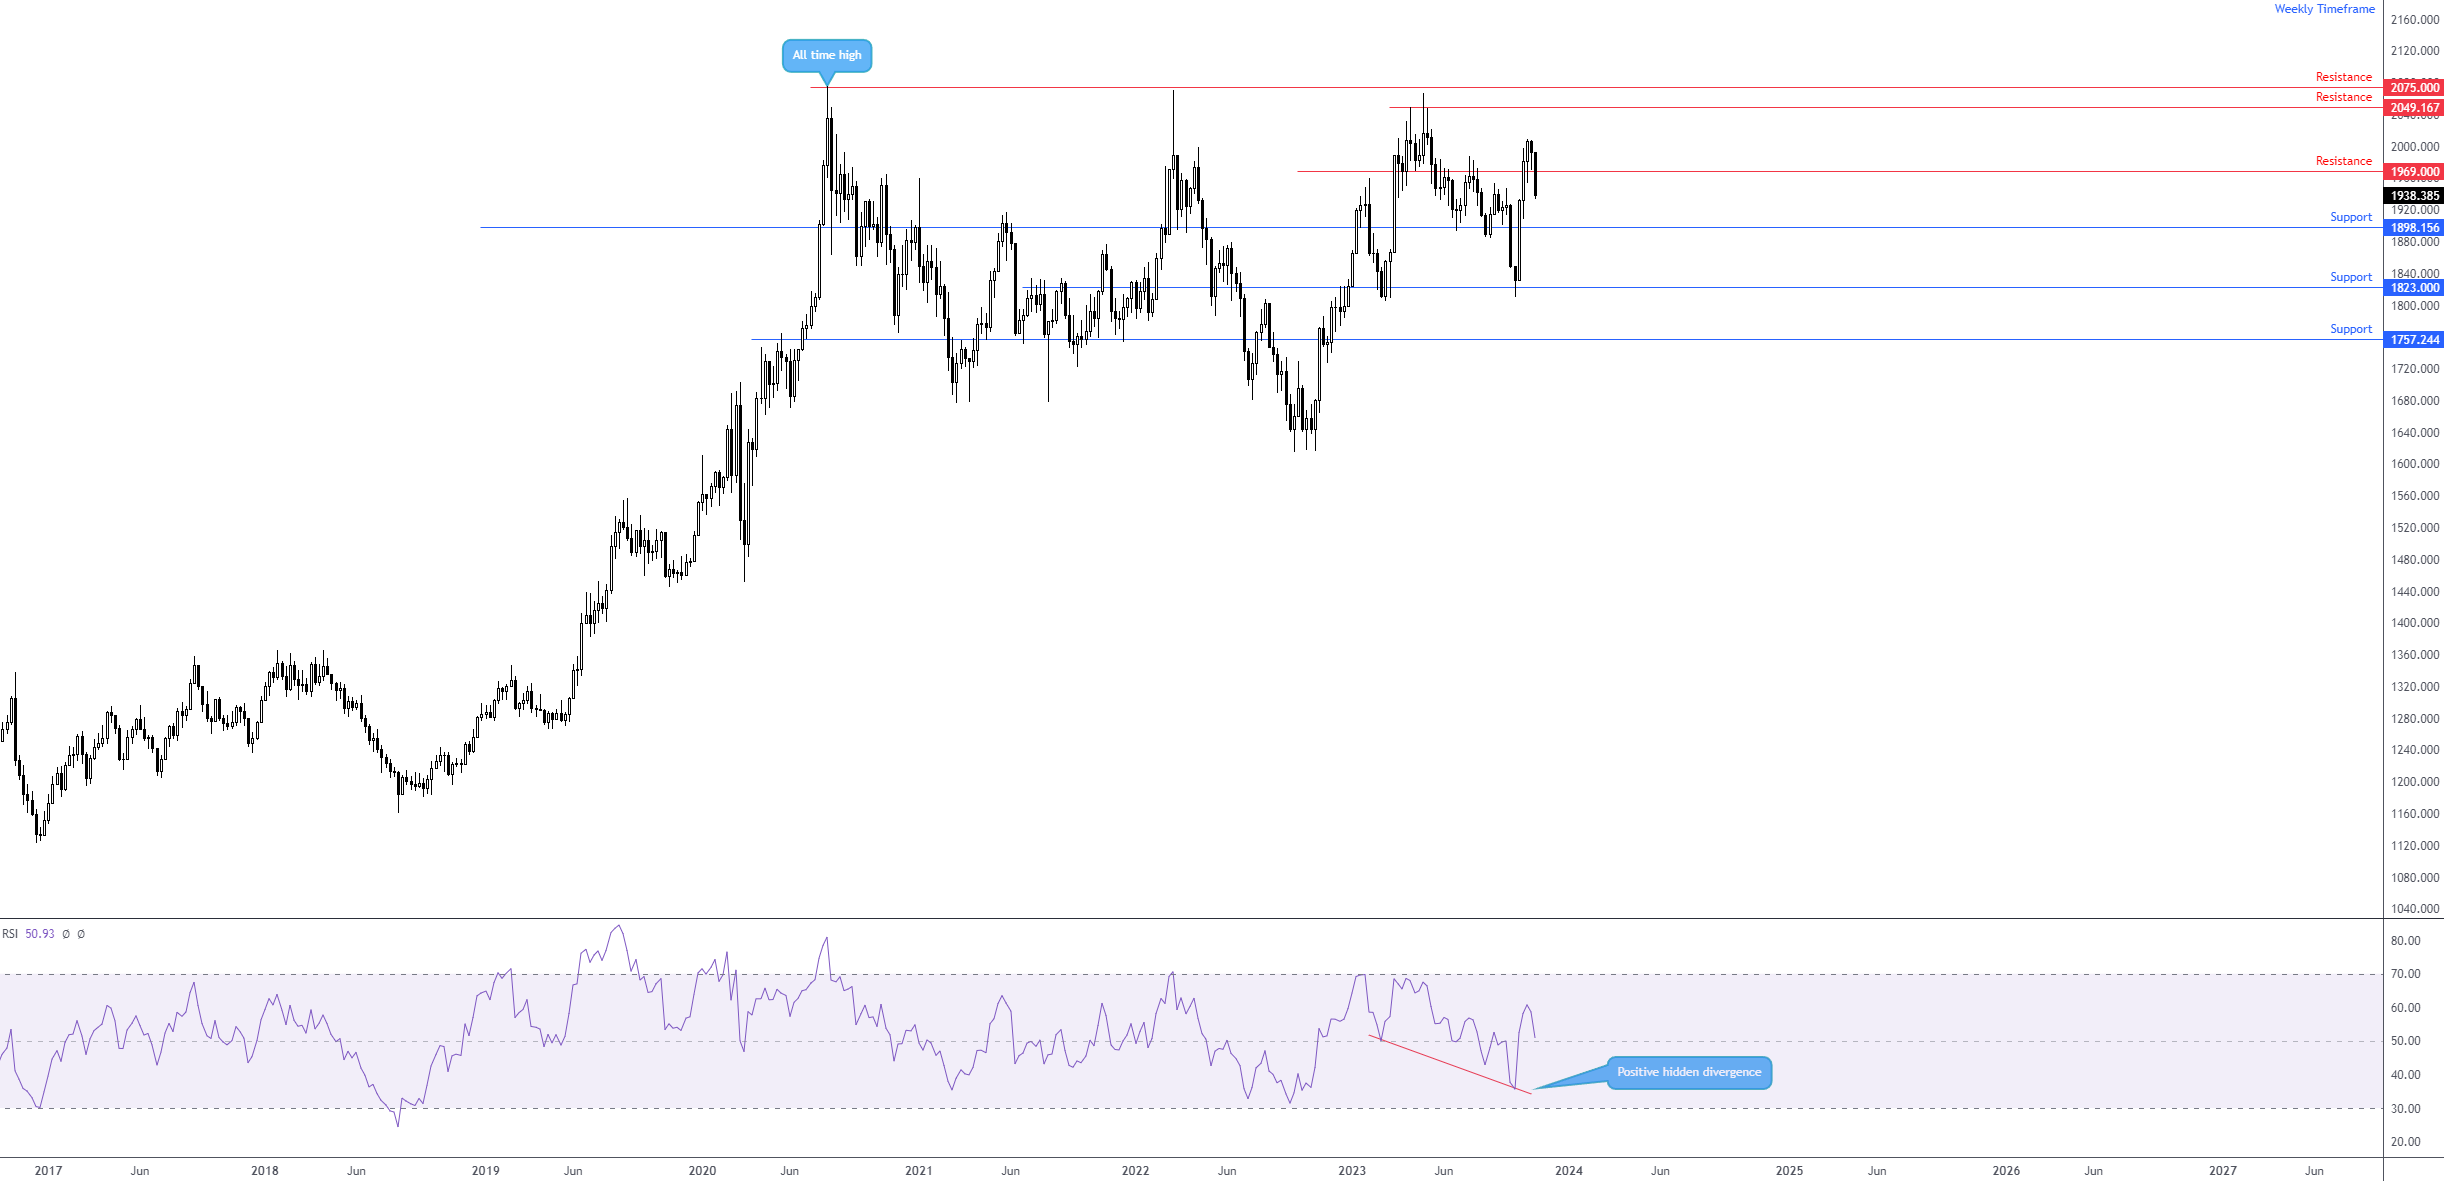
The yellow metal had a tough time last week against its US counterpart. XAU/USD settled the week down -2.7% and crushed hopes of a rebound from weekly support from $1,969 (now marked resistance). The weekly timeframe offers little regarding trend direction and has been rangebound since forming its all-time high of $2,075 in August 2020. With $1,969 effectively in the rear-view mirror, support calls for attention at $1,898 this week with a break lower exposing support from $1,823.
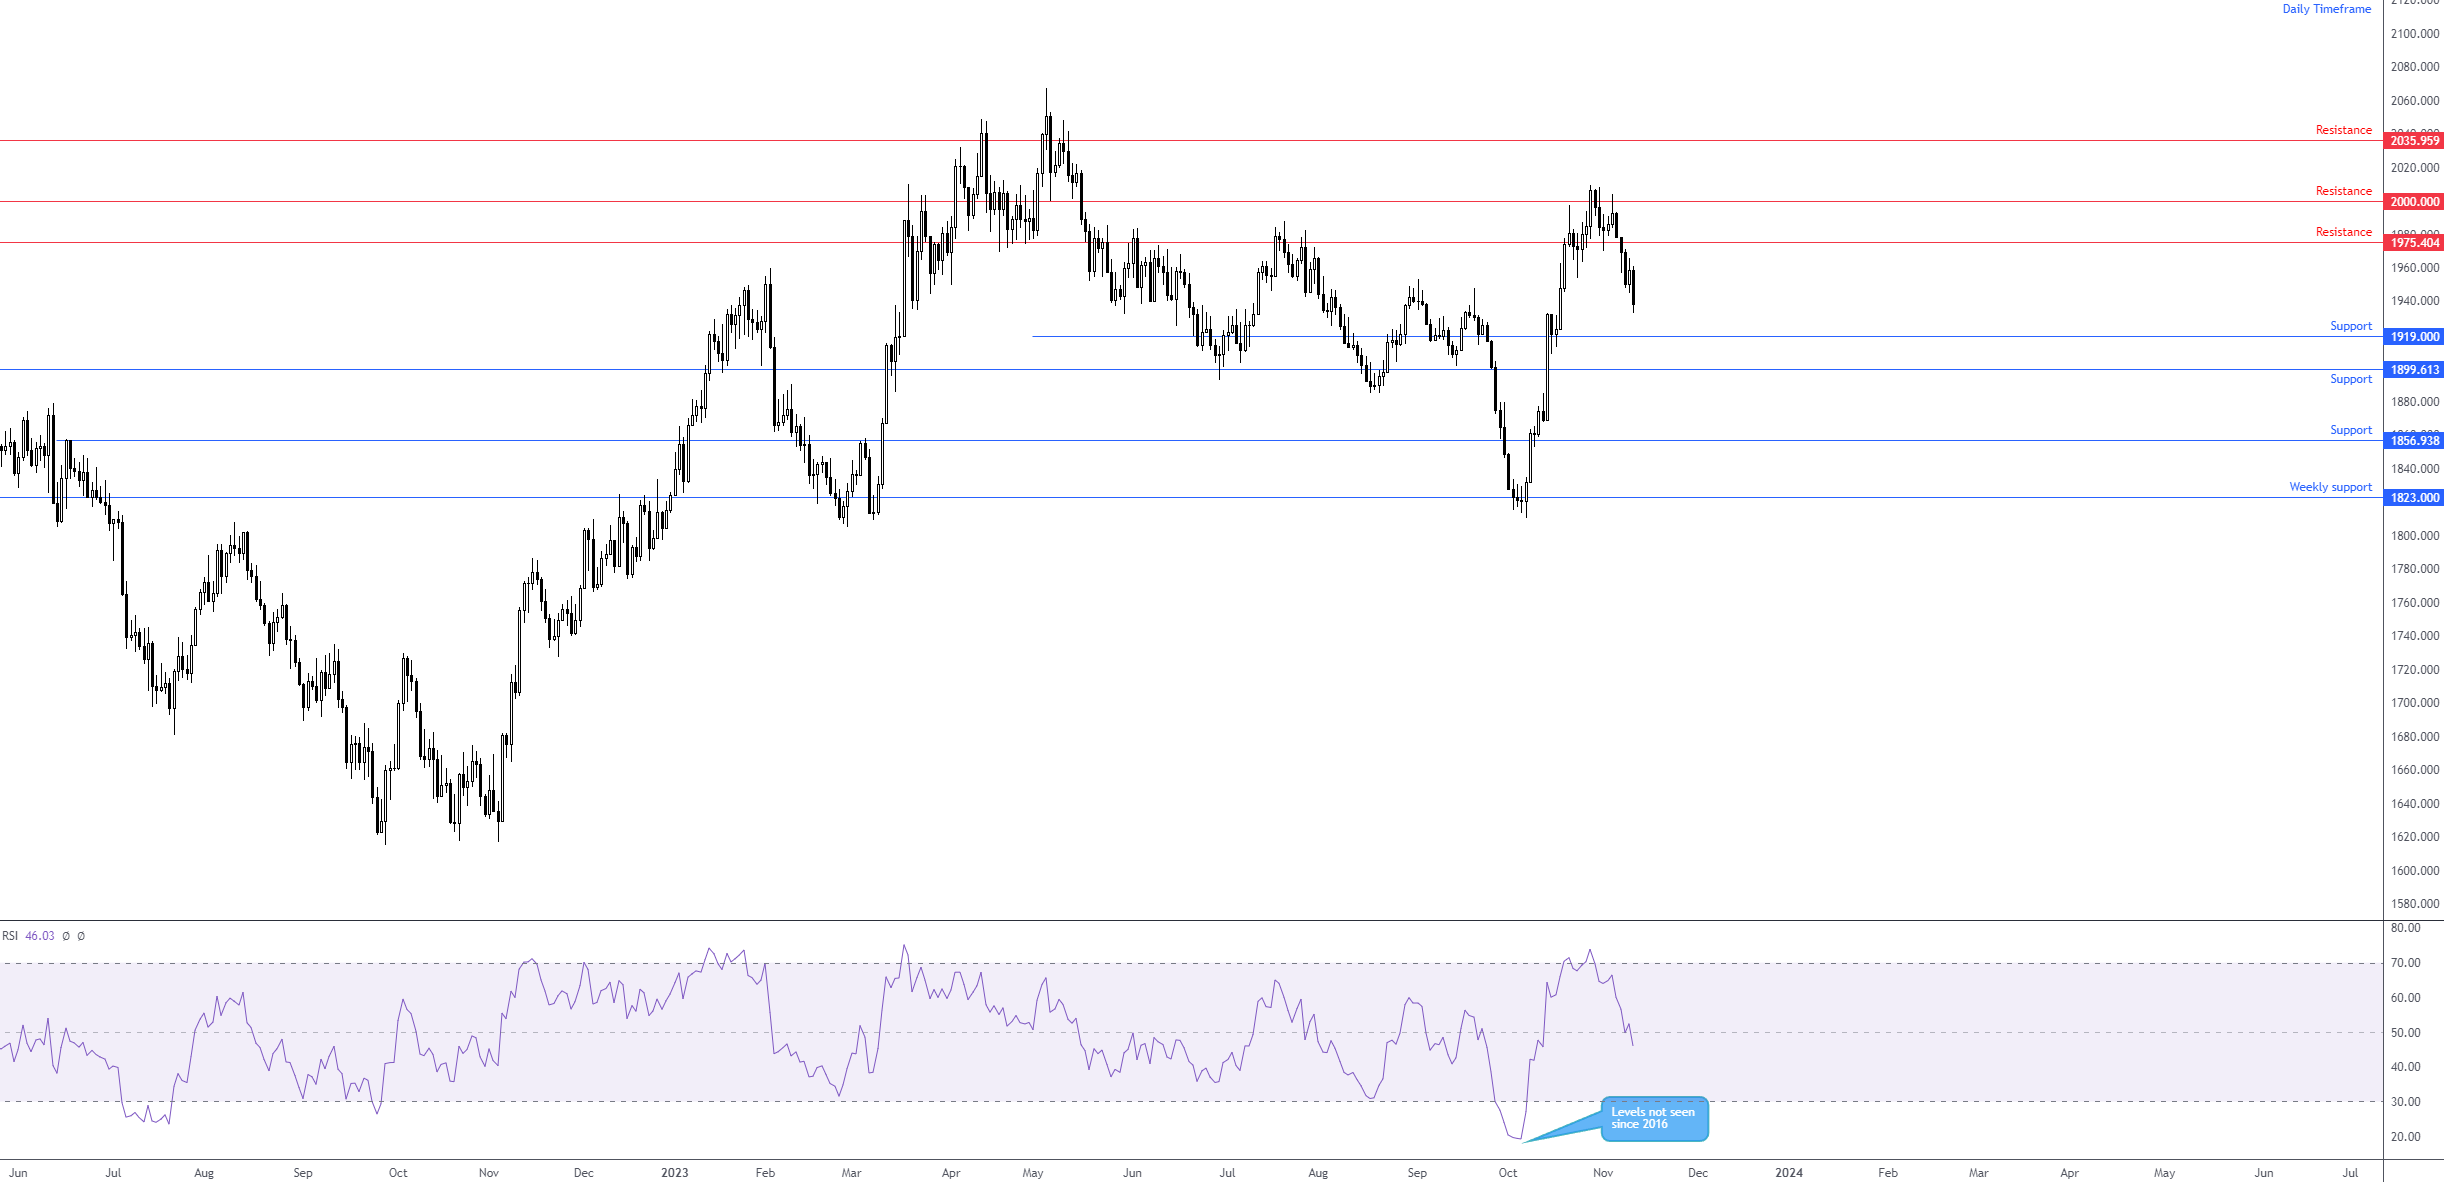
On the daily timeframe, a similar vibe is seen where we have limited support on the radar until $1,919 after the yellow metal made its way under support at $1,975 (now resistance).
Together with the Relative Strength Index (RSI) moving beneath the 50.00 centreline (negative momentum) and the weekly RSI closing in on the 50.00 centreline, it would appear that bears are set to remain in control this week, targeting $1,919 and $1,898
Weekly chart
Source: TradingView
Daily chart
Source: TradingView
XAG/USD (Silver)
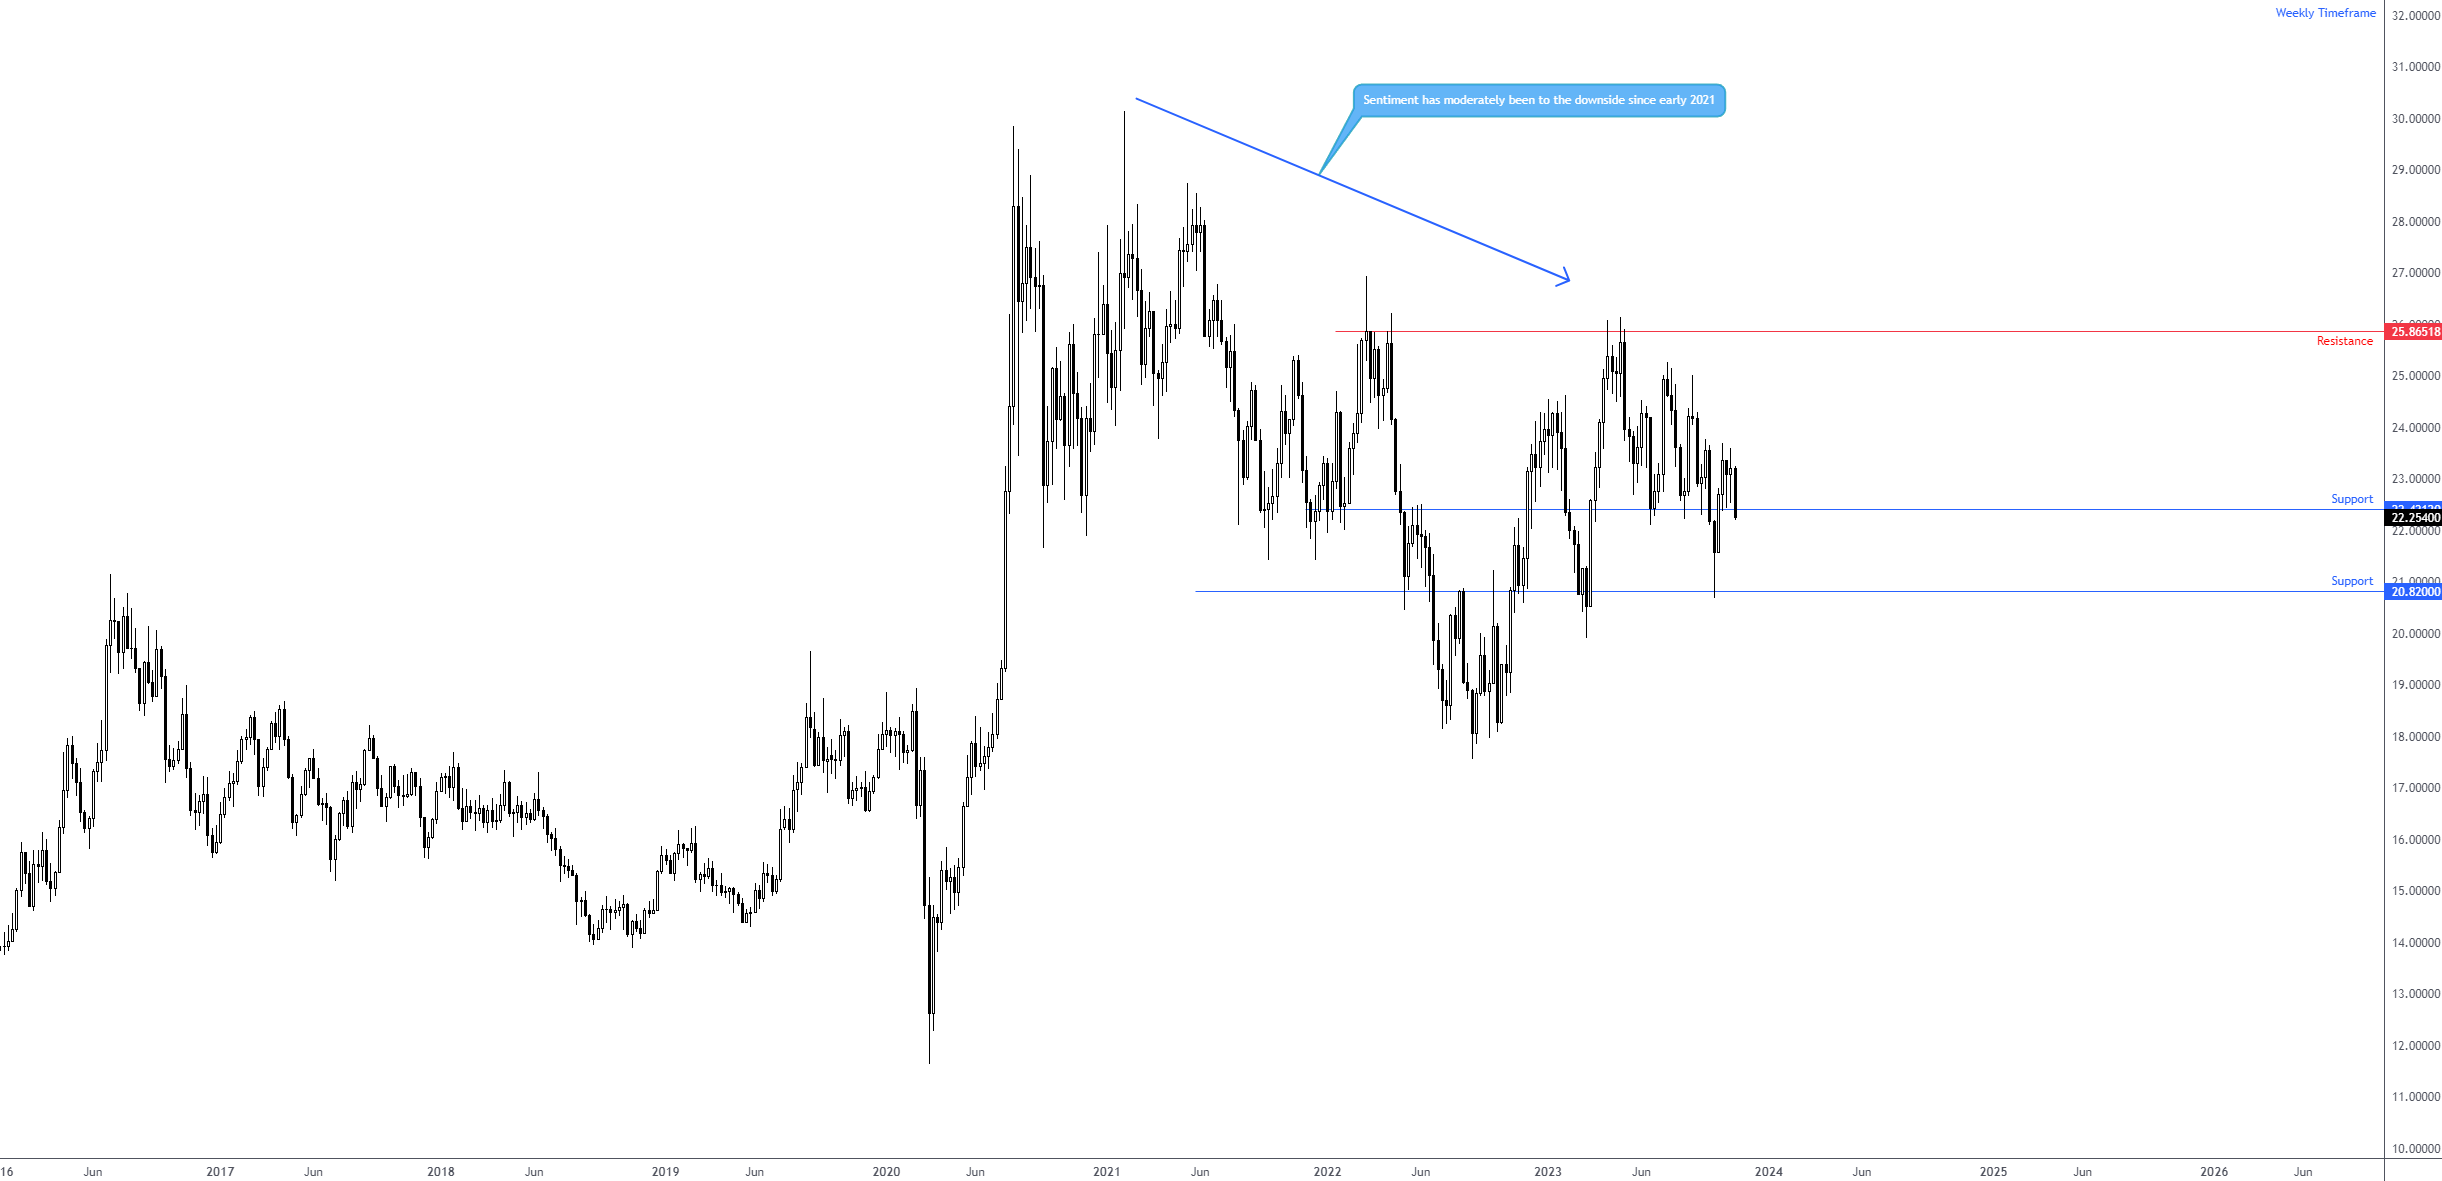
Much like the price of gold, spot silver wrapped up the week at its lows versus the buck, down -4.1%. Overall, the trend is to the downside for the price of silver and has largely been southbound since early 2021.
What we can see from the weekly timeframe of XAG/USD is that support from $22.42 is being challenged. Clearing bids at this area prepares the ground for further losses towards support from $20.82. Consequently, if sellers continue to control things, potential headwinds are limited.
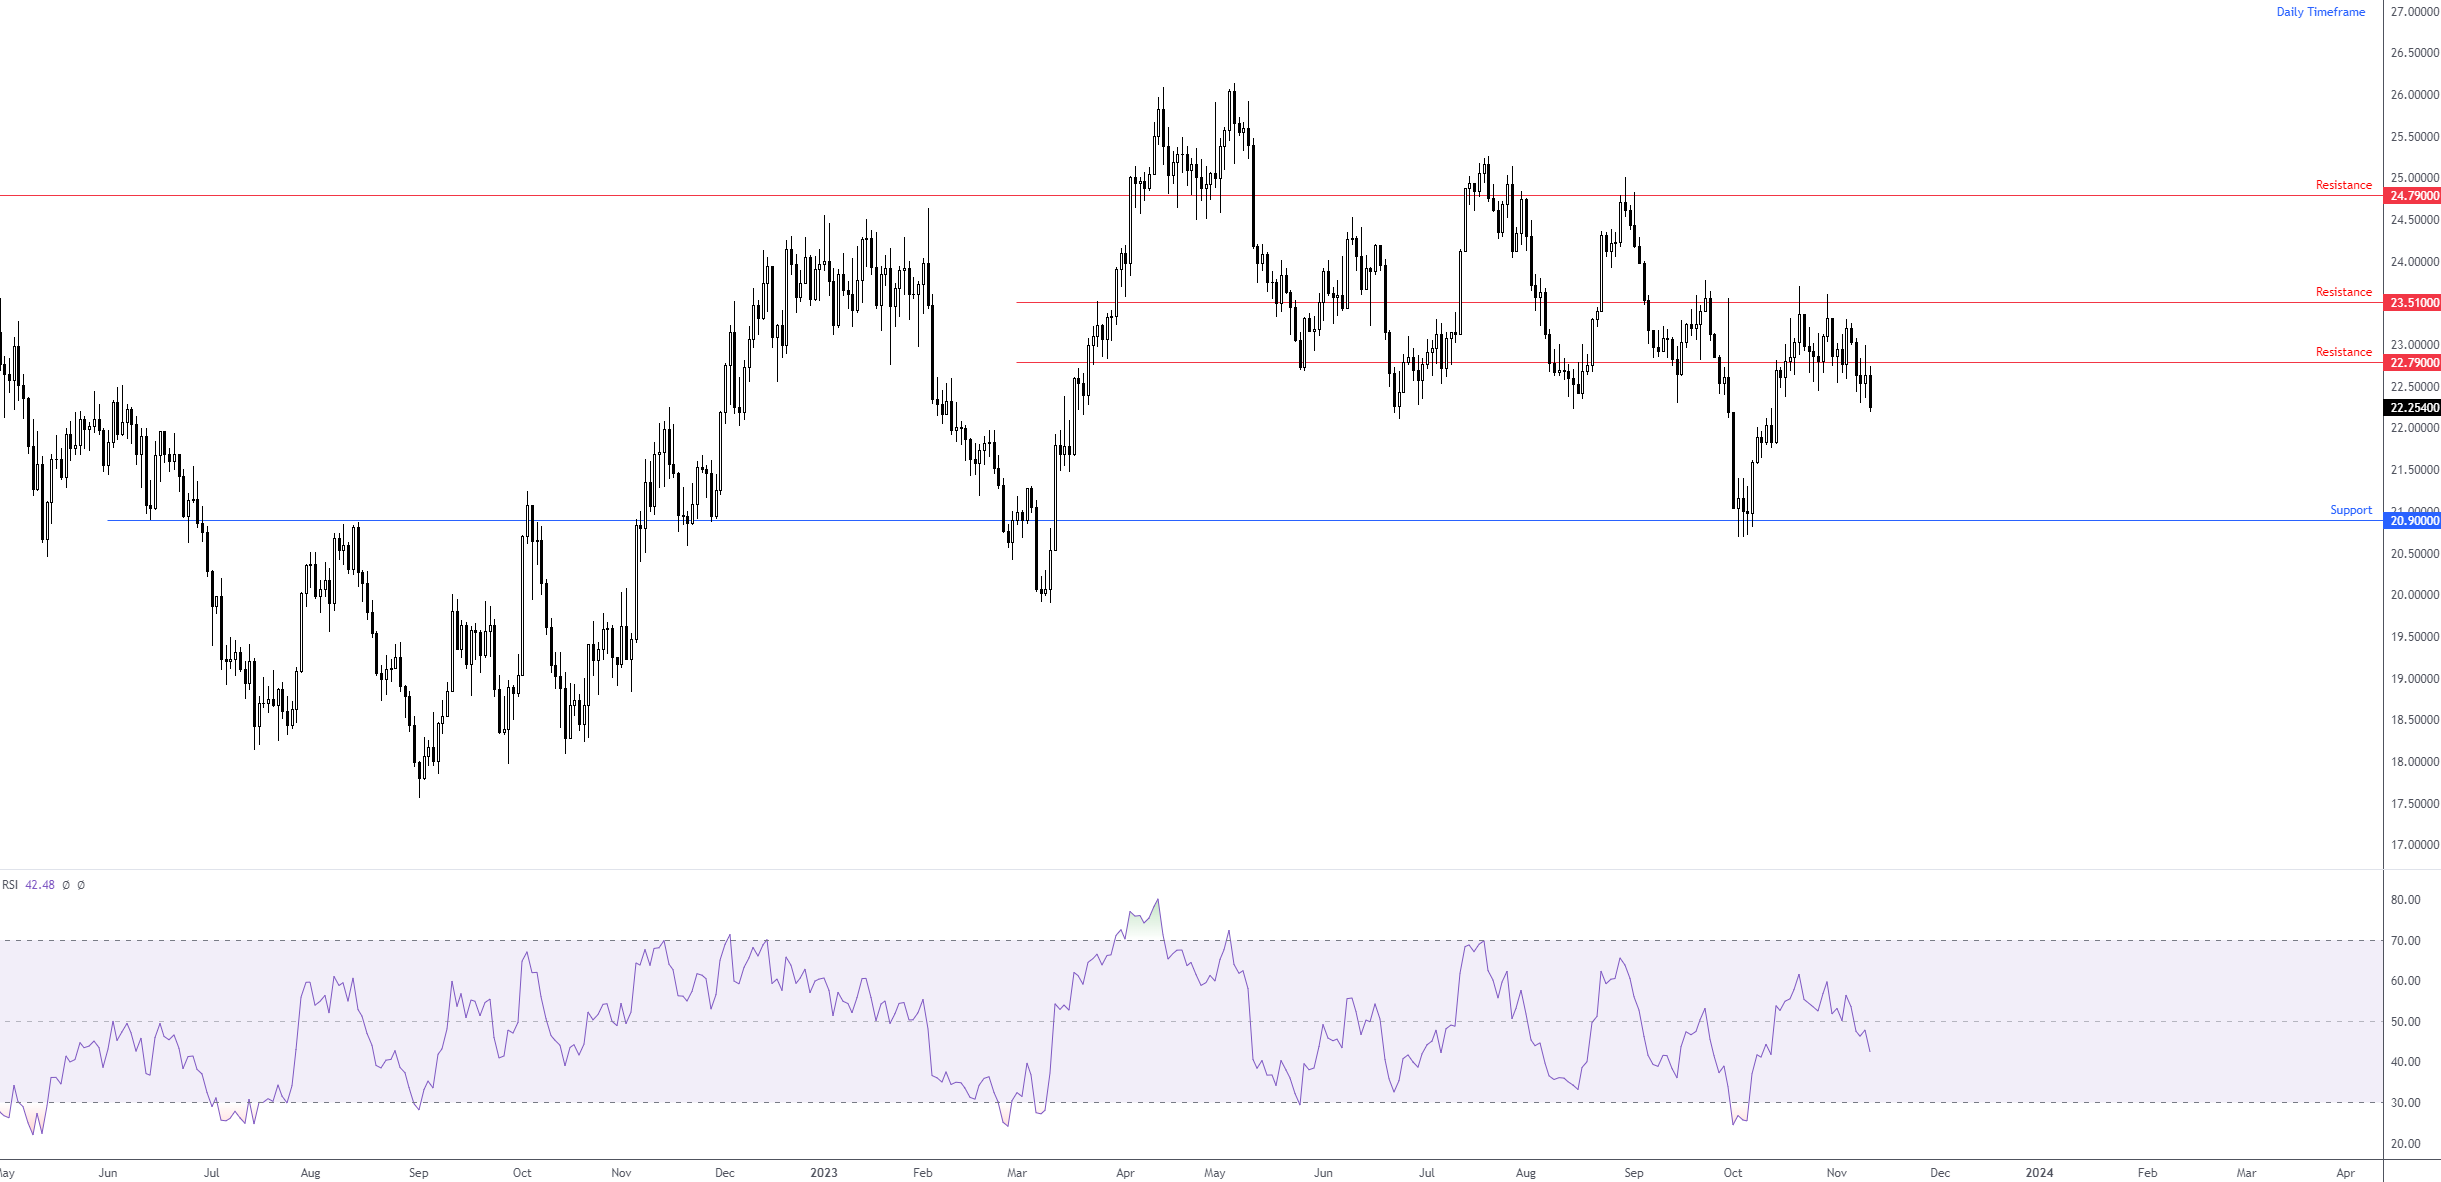
This is emphasised on the daily timeframe after the metal retested the underside of resistance at $22.79 and finished Friday at lows. Limited support is also seen on the daily chart until $20.90.
Thus, bears could remain in the driving seat until reaching at least $20.90.
Weekly chart
Source: TradingView
Daily chart
Source: TradingView
WTI Oil
The price of WTI oil finished another week lower, down -4.4%.
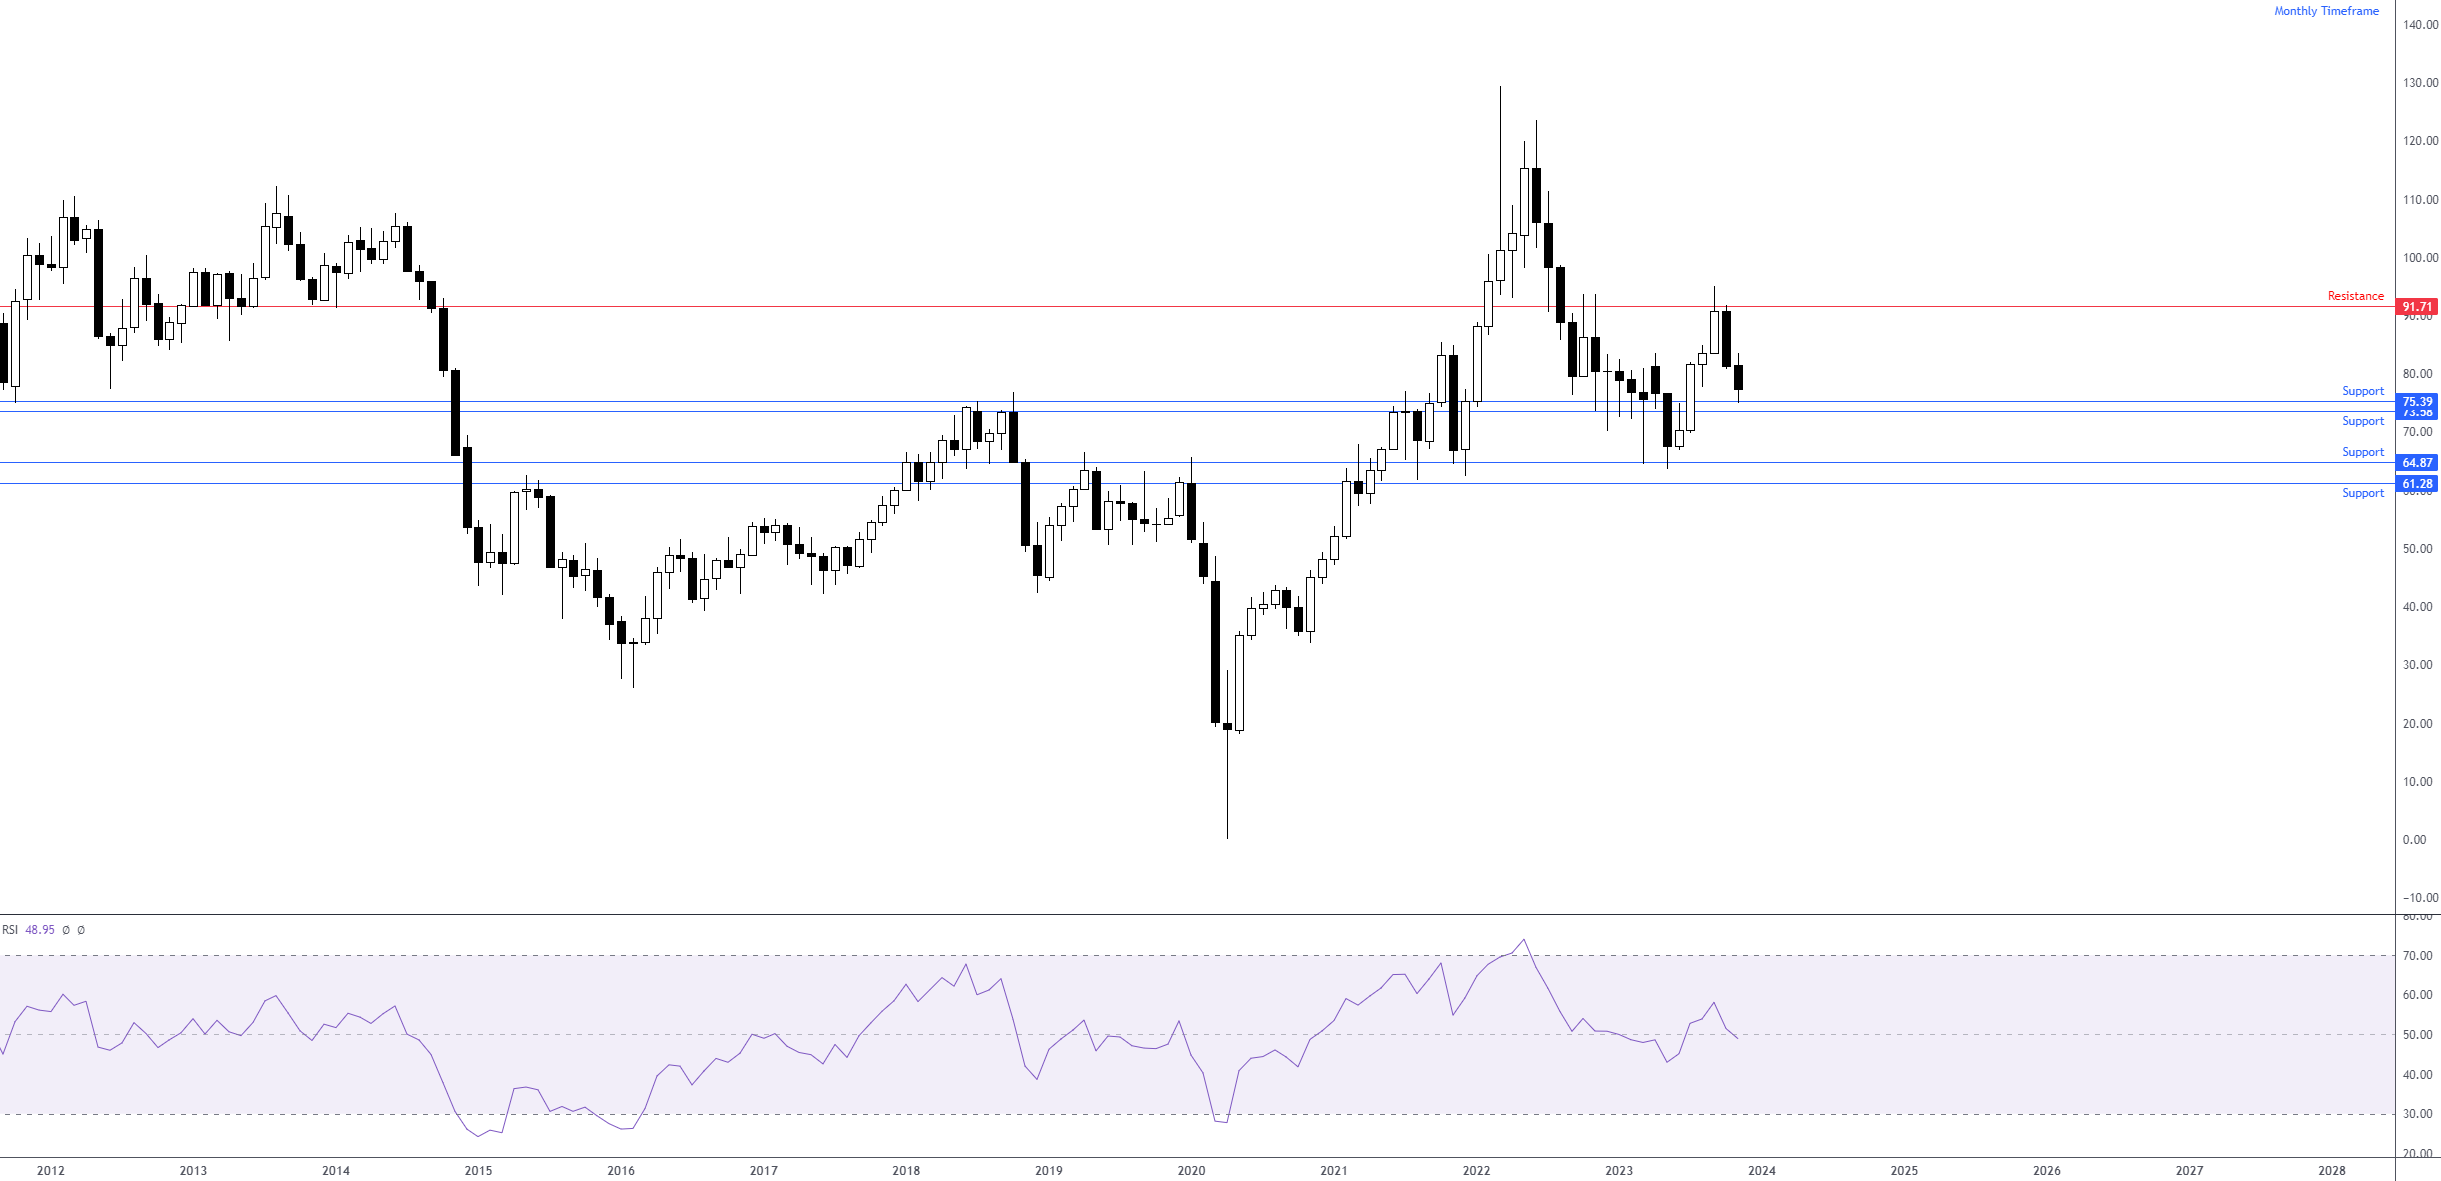
As seen from the monthly timeframe, since bumping heads with resistance at $91.71, the price of oil has been lower. Last week, however, finished testing support at $75.39, a support nestled just north of another layer of support at $73.58. Continued downside, nevertheless, could see price action aim for support between $61.28 and $64.87. Also of relevance for those who follow the Relative Strength Index (RSI), the indicator moved under the 50.00 centreline in recent trading (negative momentum).
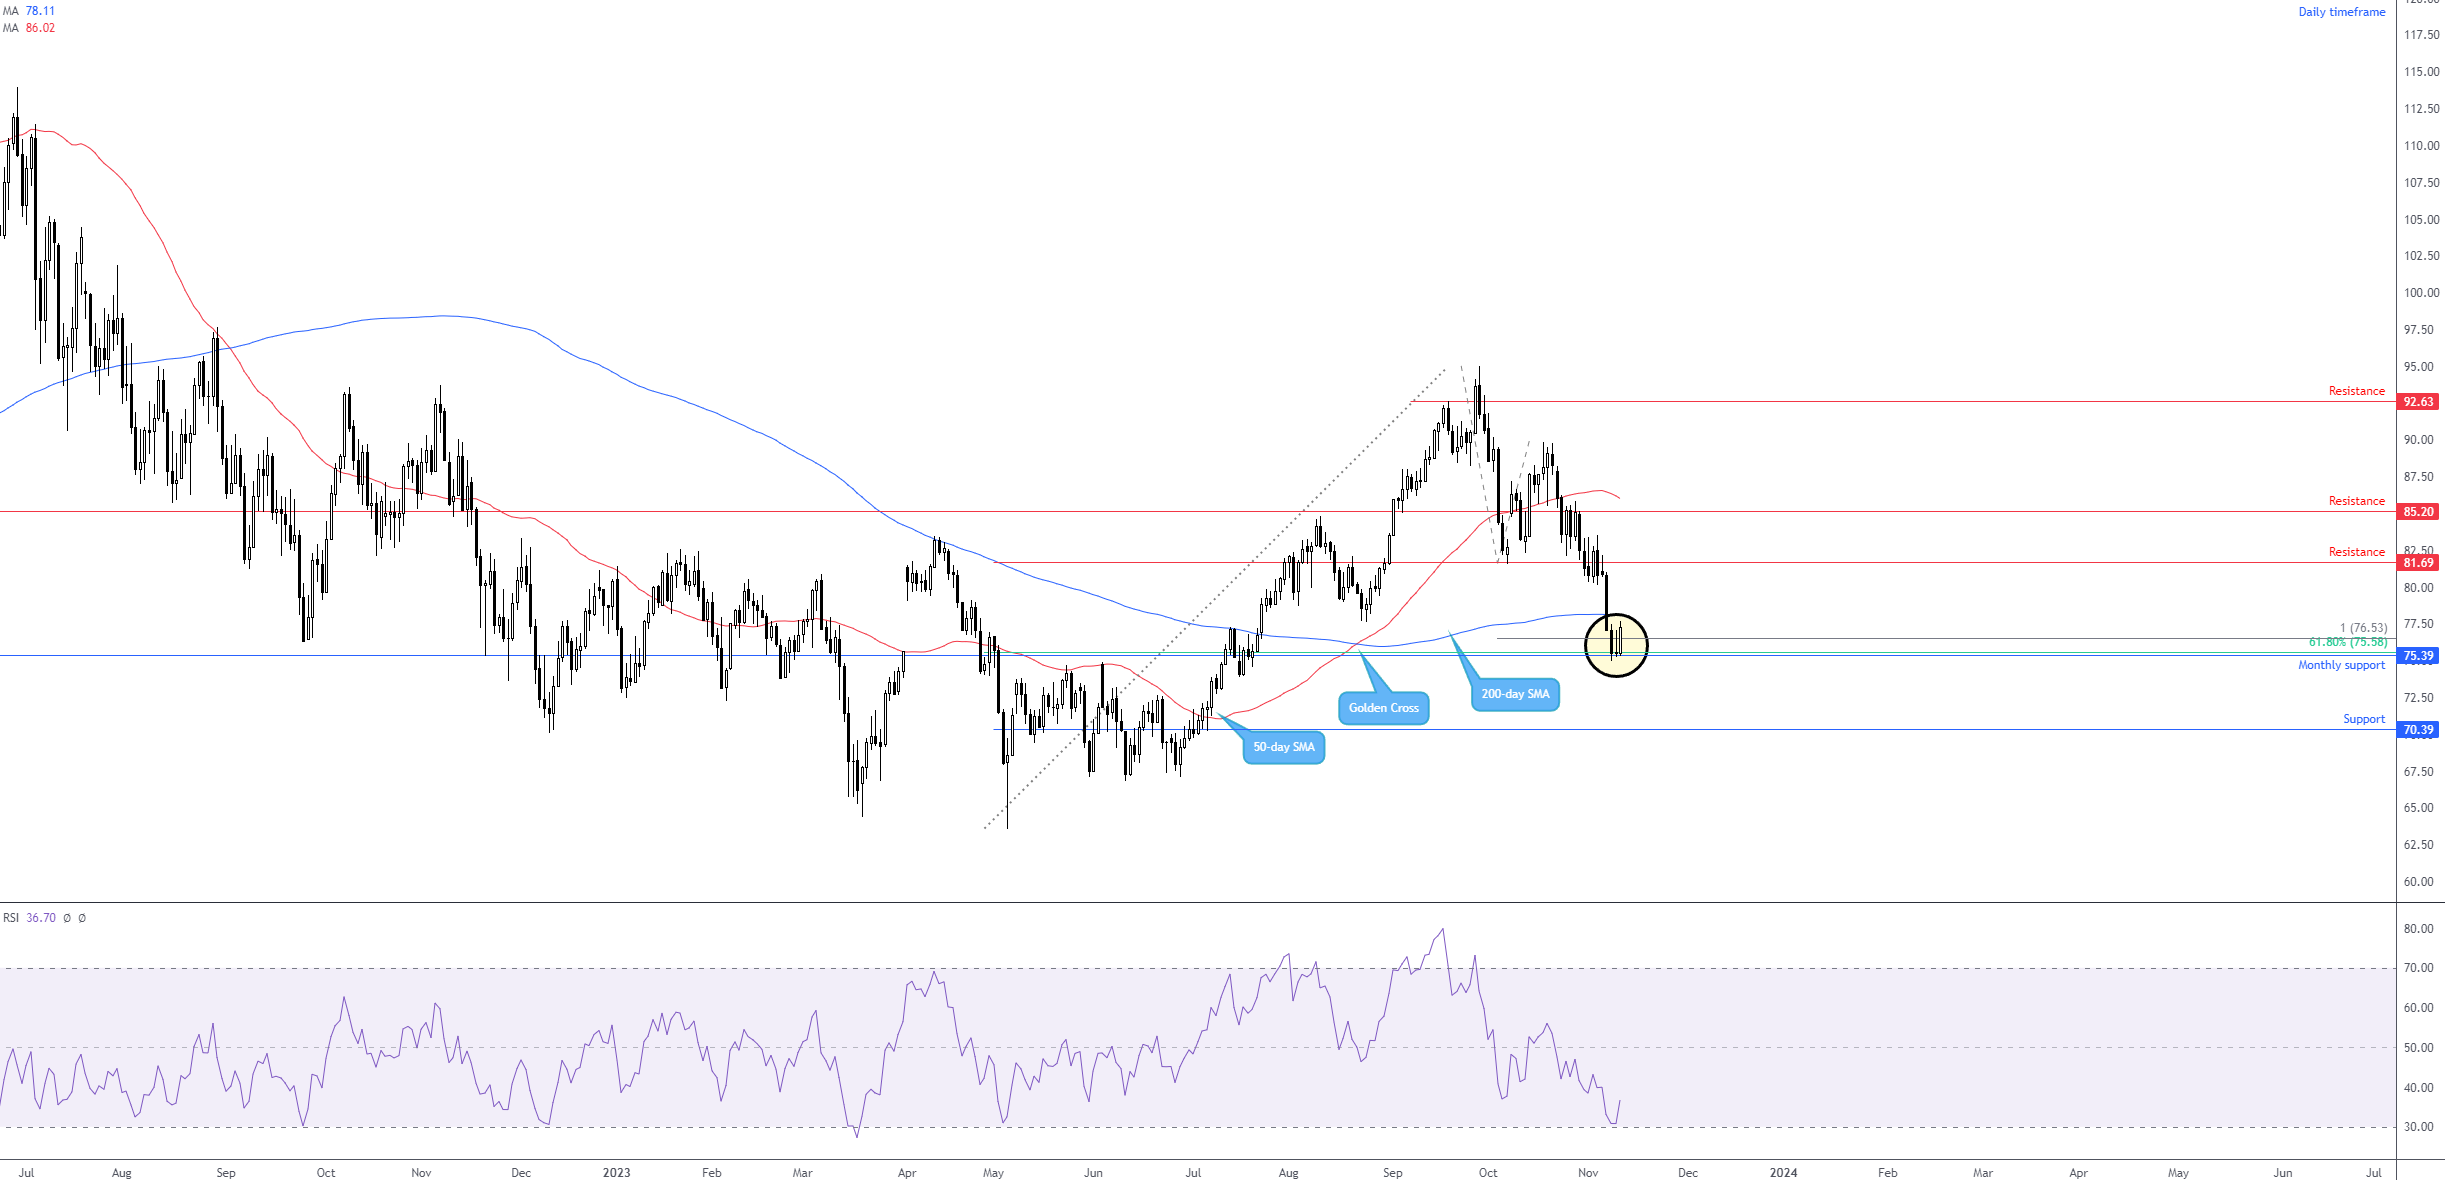
Across on the daily timeframe, the monthly support level mentioned above at $75.39 is joined by an equivalent AB=CD harmonic support pattern at $76.53 (100% projection ratio) and a 61.8% Fibonacci retracement ratio from $75.58. While this represents technical confluence, and buyers made a show from the area on Friday, for buyers to continue to move north, they’d need to clear offers around the 200-day simple moving average at $78.11. Suppose buyers fail to find acceptance at current levels and manoeuvre beneath support. In that case, daily structure shines the technical light towards support at $70.39 (though do remember before getting here, sellers must contend with support on the monthly chart at $73.58).
Monthly chart
Source: TradingView
Daily chart
Source: TradingView
Author

Aaron Hill
FP Markets
After completing his Bachelor’s degree in English and Creative Writing in the UK, and subsequently spending a handful of years teaching English as a foreign language teacher around Asia, Aaron was introduced to financial trading,


