Coffee Elliott Wave technical analysis [Video]
![Coffee Elliott Wave technical analysis [Video]](https://editorial.fxstreet.com/images/Markets/Commodities/Agriculture/Coffee/coffee-beans-44253278_XtraLarge.jpg)
Coffee Elliott Wave analysis
Since its peak in September 2011, coffee prices have shown a notable retreat from their mid-September 2024 highs. It appears that the market has completed a corrective technical structure, indicating a potential further decline before resuming a long-term bullish trajectory
Long-term chart analysis
Historically, coffee prices have fluctuated within a broad range, with key support levels situated between $40 and $55, and resistance levels reaching from $276 to $337. The current bullish cycle commenced in May 2019, initiating a significant upward movement. This cycle's first phase peaked in February 2022, marking a period of notable highs. Following this, a corrective second phase concluded with a bottom in January 2023. From this low, we entered the third and ongoing phase of the bullish cycle, which is developing as part of a larger corrective pattern within the overarching Elliott Wave structure.
The third phase of this rally appears to be unfolding as a corrective wave, integrated within the broader impulse that initiated in 2019. Although the current price action hints at the possibility of further gains in the future, a substantial pullback seems imminent before the uptrend can continue.
Daily chart analysis
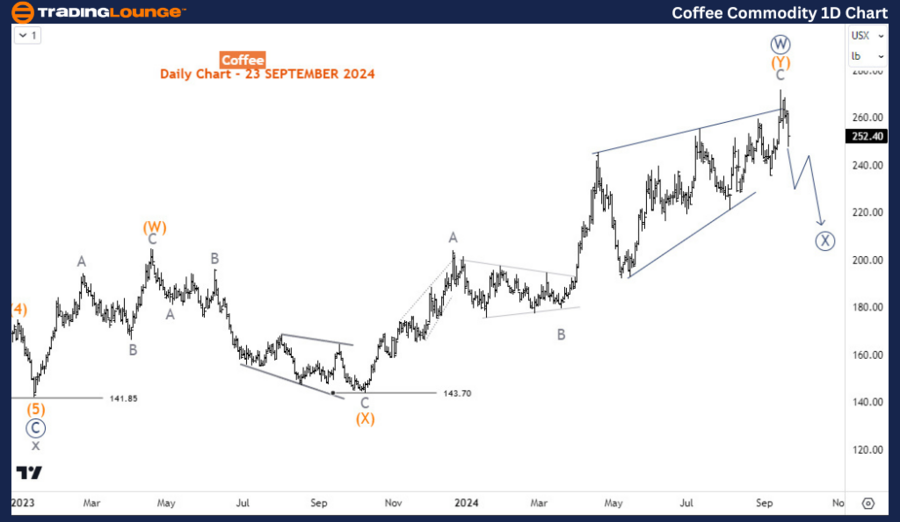
Examining the daily chart, we see that the third phase of recovery completed its first leg, labeled wave (W), in April 2023. This was followed by a three-wave corrective structure, wave (X), which found support at 143.70 in October 2023. The subsequent rally represents wave (Y) of the primary degree wave W (circled), indicating the completion of this bullish phase.
Wave (Y) of W (circled) appears to have formed an ending diagonal structure, suggesting the uptrend is losing momentum. If this structure is indeed complete, a corrective pullback in wave X (circled) is likely. The expected correction could manifest as a double zigzag, a complex pattern that typically leads to additional downside before the primary uptrend resumes.
H4 chart analysis
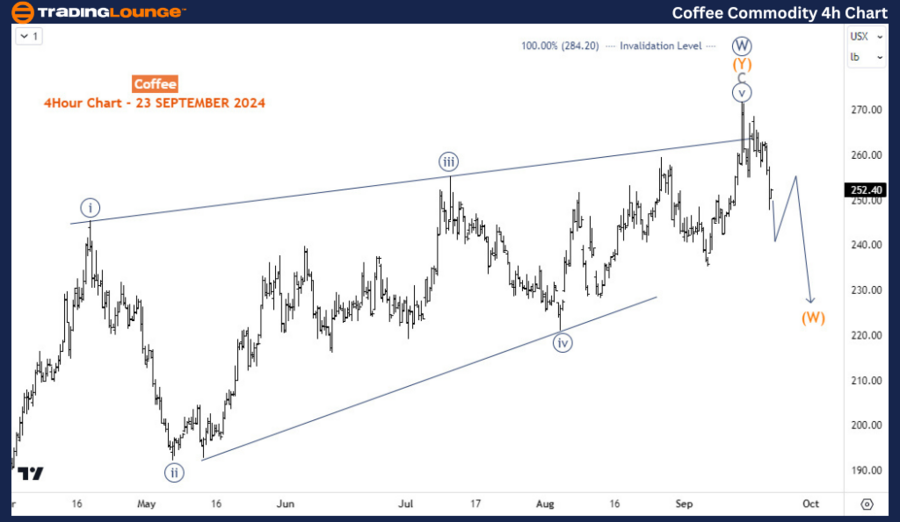
On the H4 chart, we can further pinpoint the completion of wave (Y) of W (circled) with the identification of an ending diagonal structure. Thus, we anticipate a corrective dip for wave X (circled) to follow. The recent decline since mid-September 2024 suggests that prices are still operating within the wave (W) of X (circled), which supports a bearish outlook in the short to medium term. Nevertheless, the long-term perspective remains bullish, suggesting that after the expected correction, coffee prices are likely to resume their upward trend.
Technical analyst: Sanmi Adeagbo.
Coffee Elliott Wave analysis [Video]
Author

Peter Mathers
TradingLounge
Peter Mathers started actively trading in 1982. He began his career at Hoei and Shoin, a Japanese futures trading company.


