Coffee Elliott Wave technical analysis [Video]
![Coffee Elliott Wave technical analysis [Video]](https://editorial.fxstreet.com/images/Markets/Commodities/Agriculture/Coffee/coffee-beans-background-46166242_XtraLarge.jpg)
Coffee Elliott Wave analysis
Function - Counter-trend.
Mode - Corrective.
Structure - Triangle wave X.
Position - Wave X still in play.
Direction - Sideways for X of (X).
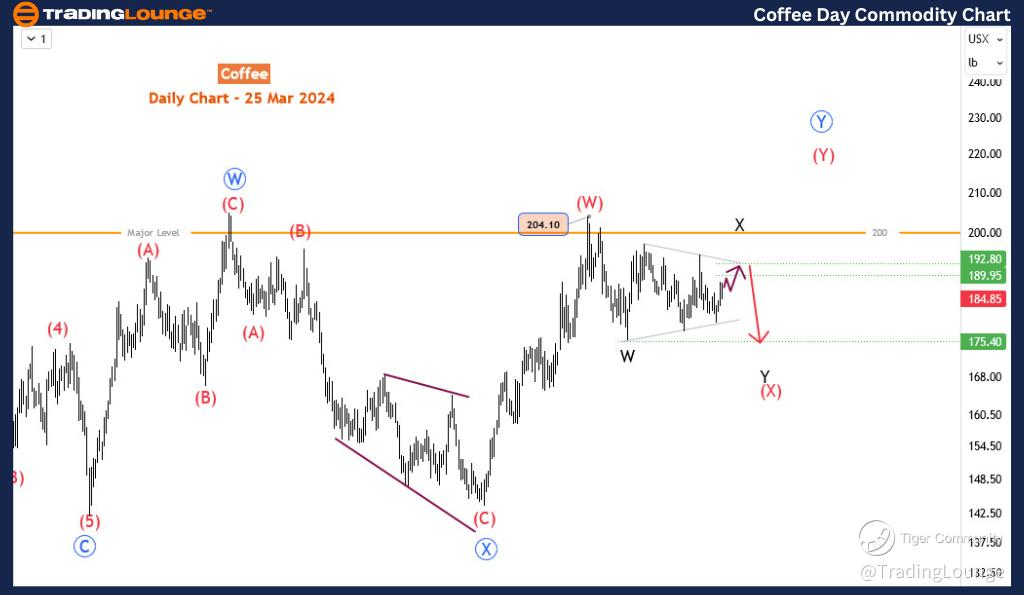
Details - Not much has changed since the last update. The last leg of triangle wave X is currently emerging and should rally toward the 189.95-192.80 key zone where it might find resistance. This has a bearish outlook for wave Y of (X).
After shedding just over 14% between December 19th and January 18th, the commodity has remained stagnant since then, fluctuating between 197.5 and 175.5 for over two months. Currently, the price is retracing towards the upper limit of this range, potentially signaling its conclusion. We anticipate either a breakthrough above $197.5 or a decline below $175.5. From an Elliott wave perspective, the downside appears more likely as the pullback from December 19th deepens. In today’s commodity blog post, we will analyze evolving patterns, key levels, and the broader framework to forecast Coffee's future trajectory.
On the daily chart, a significant bullish double-three pattern began in January 2023, completing its first leg, labeled as blue wave ‘W’, in April of the same year. Blue wave ‘X’ followed, descending to the low observed in October 2023. Subsequently, the price rebounded to initiate wave ‘Y’, projected to advance to at least the 100% extension level near $208. However, it peaked at $204 and retreated, encountering strong resistance at the major level of $200.
Following this decline, the commodity has remained stagnant, suggesting that wave Y may not have concluded. The rally to $204 likely represents wave (W) of blue ‘Y’, with the corresponding wave X expected to form another double-three pattern. Wave X of (X) is currently completing a triangle, as will be clearer on the 4-hour chart. Following the triangle's completion, wave Y of (X) is anticipated to emerge below $175.4. However, if a breakout above the triangle occurs above $197.5, wave (X) may have concluded, and wave (Y) would continue upon breaking above $200. Nonetheless, the former scenario seems more probable, and that's the perspective we will adopt until proven otherwise by price movements.
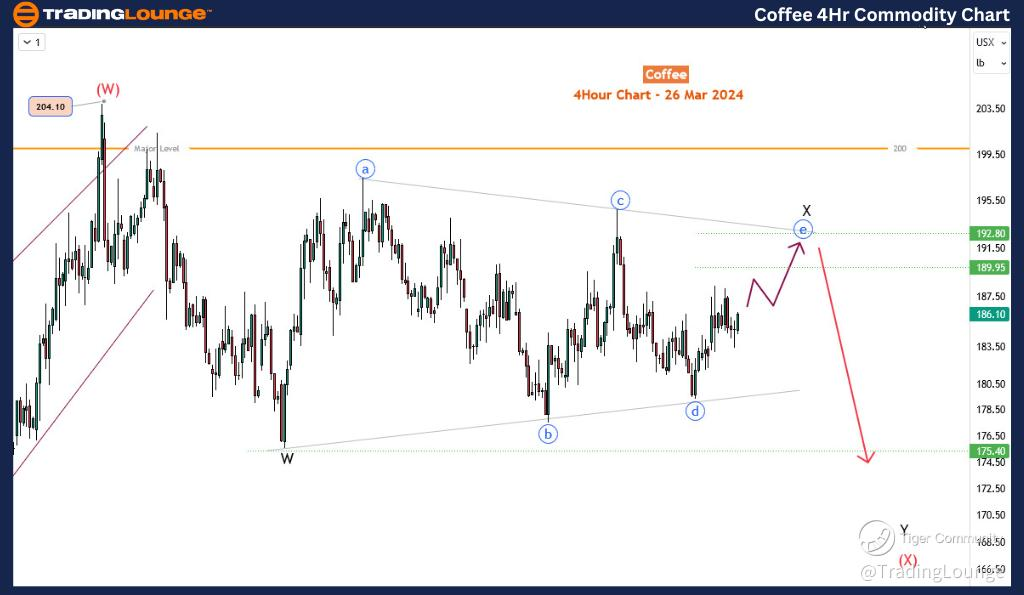
On the 4-hour timeframe, the fifth leg of the triangle, identified as blue wave ‘e’, is forming upwards. It is expected to encounter resistance within the 189.95-192.8 supply zone. Wave Y is anticipated to commence from there, provided the peak of blue wave ‘c’ remains unbroken. Selling opportunities may arise with the emergence of wave Y in the medium term, potentially leading to a decline below $175.5.
In summary, while there are alternative scenarios beyond those discussed, these are currently the most plausible. However, flexibility is crucial to adjust our analysis according to evolving price actions. At present, these scenarios offer the clearest insights.
Coffee Elliott Wave technical analysis [Video]
Author

Peter Mathers
TradingLounge
Peter Mathers started actively trading in 1982. He began his career at Hoei and Shoin, a Japanese futures trading company.


