|

Cocoa Elliott Wave technical analysis [Video]

Cocoa Elliott Wave analysis

Cocoa prices are sharply falling in late May, giving up most of the gains made earlier in the month. This suggests that the downward trend starting from December 2024 is continuing. If the May high holds, prices could move down toward 5980 in the next few weeks. According to the Elliott Wave pattern, this move is a correction of the 5-wave rise that started in June 2020.

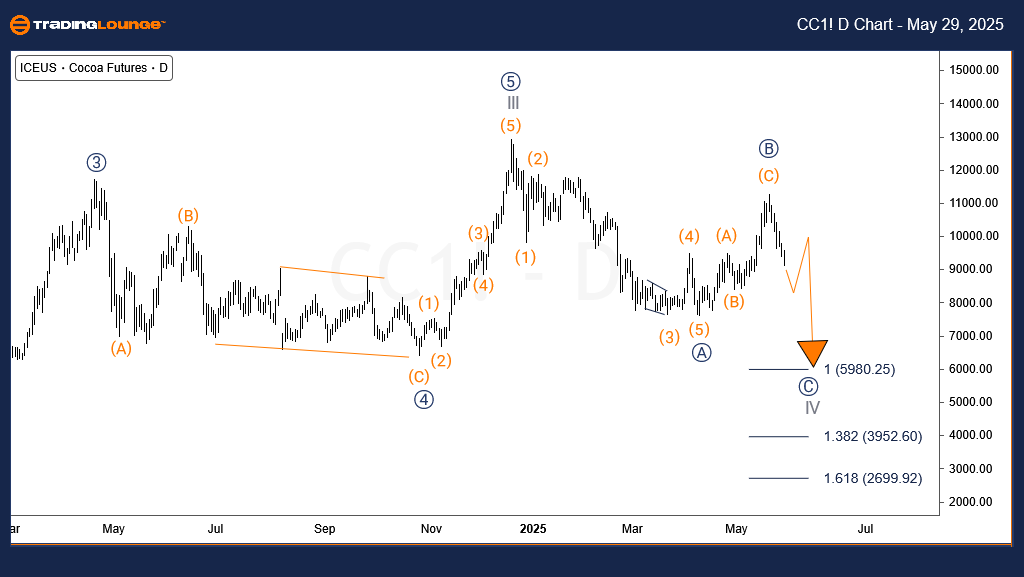
Cocoa long-term view and daily chart analysis

Cocoa has been in a long-term upward trend since May 1992. The first major wave, labeled ((I)), ended in March 2011. After that, wave ((II)) pulled back and finished in March 2017. From that point, wave ((III)) began rising. The sub-wave III of (III) of ((III)) peaked in December 2024. A pullback labeled wave IV began from this high. Wave ((A)) of IV completed a 5-wave pattern in April 2025. This was followed by a zigzag pattern for wave ((B)), which ended on May 20, 2025. The price is now expected to continue falling in another 5-wave pattern, targeting the 5980 to 3952 range.

Chart

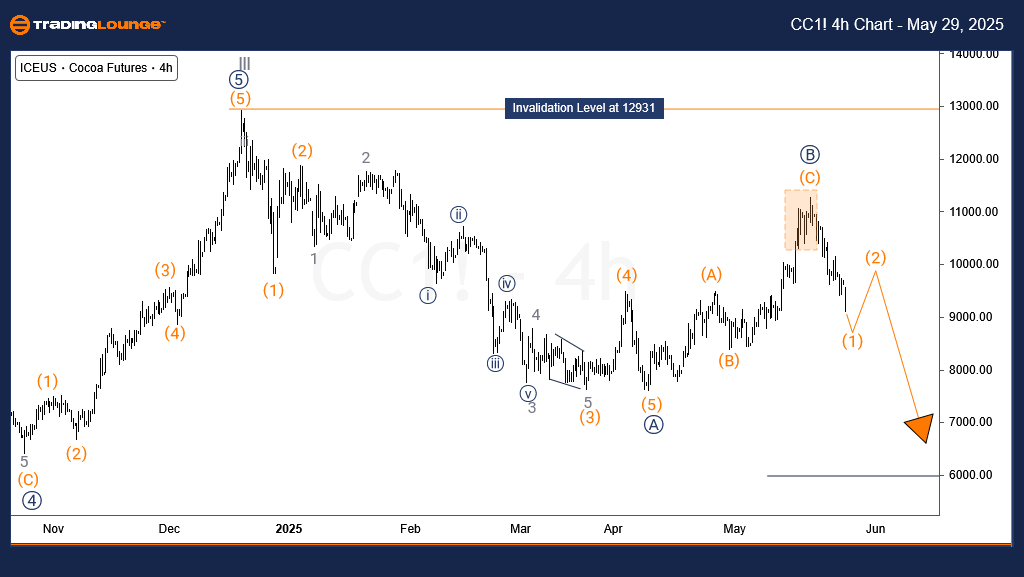
Cocoa four-hour chart analysis

The H4 chart shows wave ((B)) ending at the upper resistance zone, which gave sellers a chance to enter. The price is now in wave (1) of ((C)) and likely to drop more with short-term rebounds. As long as the price stays below the May 20 high, the trend is expected to continue downward, aiming for 5980 in the coming sessions.

Cocoa

Cocoa Elliott Wave technical analysis [Video]

Author

Peter Mathers

Peter Mathers

TradingLounge

Peter Mathers started actively trading in 1982. He began his career at Hoei and Shoin, a Japanese futures trading company.

More from Peter Mathers
Share:

Editor's Picks

EUR/USD hits two-day highs near 1.1820

EUR/USD picks up pace and reaches two-day tops around 1.1820 at the end of the week. The pair’s move higher comes on the back of renewed weakness in the US Dollar amid growing talk that the Fed could deliver an interest rate cut as early as March. On the docket, the flash US Consumer Sentiment improves to 57.3 in February.

GBP/USD reclaims 1.3600 and above

GBP/USD reverses two straight days of losses, surpassing the key 1.3600 yardstick on Friday. Cable’s rebound comes as the Greenback slips away from two-week highs in response to some profit-taking mood and speculation of Fed rate cuts. In addition, hawkish comments from the BoE’s Pill are also collaborating with the quid’s improvement.

Gold climbs further, focus is back to 45,000

Gold regains upside traction and surpasses the $4,900 mark per troy ounce at the end of the week, shifting its attention to the critical $5,000 region. The move reflects a shift in risk sentiment, driving flows back towards traditional safe haven assets and supporting the yellow metal.

Crypto Today: Bitcoin, Ethereum, XRP rebound amid risk-off, $2.6 billion liquidation wave

Bitcoin edges up above $65,000 at the time of writing on Friday, as dust from the recent macro-triggered sell-off settles. The leading altcoin, Ethereum, hovers above $1,900, but resistance at $2,000 caps the upside. Meanwhile, Ripple has recorded the largest intraday jump among the three assets, up over 10% to $1.35.

Three scenarios for Japanese Yen ahead of snap election

The latest polls point to a dominant win for the ruling bloc at the upcoming Japanese snap election. The larger Sanae Takaichi’s mandate, the more investors fear faster implementation of tax cuts and spending plans. 

XRP rally extends as modest ETF inflows support recovery

Ripple is accelerating its recovery, trading above $1.36 at the time of writing on Friday, as investors adjust their positions following a turbulent week in the broader crypto market. The remittance token is up over 21% from its intraday low of $1.12.