Cocoa commodity analysis and Elliott Wave technical forecast [Video]
![Cocoa commodity analysis and Elliott Wave technical forecast [Video]](https://editorial.fxstreet.com/images/Markets/Commodities/Agriculture/cocoa1-637443210149250422_XtraLarge.jpg)
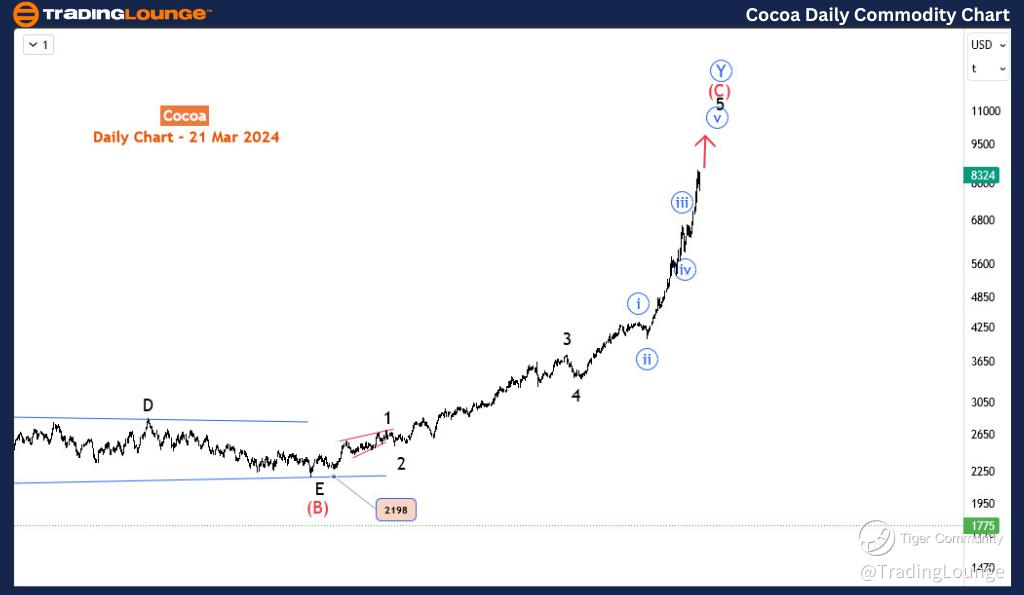
Cocoa Elliott Wave analysis
Function - Trend.
Mode - Impulsive.
Structure - Impulse Wave.
Position - Blue wave v of 5 of (C).
Direction - Upwards as Blue wave v of 5 of (C) progresses.
Details - Wave (iv) retracement completed at the top of the reversal zone we marked. Wave (v) could be heading for 9000.
Corn is about to make a new all-time high for the fourth time this year. In 2023, it closed with a massive 62% gain. However, this year, it has almost doubled in price since 1st January and we are still in March. It’s one of the best-performing financial instruments in the last 1 year. It broke above $8,000 early in the week and now could be heading to $9,000 after it completely recovers from the 18-19 March minor dip. But how far further upside could it go? Will there be a big pullback soon? How can traders take advantage of this big bullish trend? This technical analysis provides clues from the Elliott wave theory.
In the long term, the bullish trend didn’t start in 2023. It started properly in 2001 when the commodity barely traded at $709. Before the bullish trend was a multi-year decline. We will dwell more on when the trend started. In the last 22-23 years of this trend, the commodity only had major pullbacks in 2003 extended to 2004/05 before the trend continued for the next four years. Another pullback started in 2011 and lasted till 2017 before the currency phase of the bullish trend. From 2017, by projection, Cocoa could hit the 100% extension ($9,500) of the rally between 2001-to-2011 from the end of the pullback in 2017.
On the daily chart, an Elliott wave analysis of the trend from September 2022 suggests we are in the last wave i.e. wave 5 of (C). Meanwhile, the sub-wave ‘v’ (in blue) of 5 is not yet completed and could hit $9,500. This is going to be the next target for Cocoa in both the medium and short term.
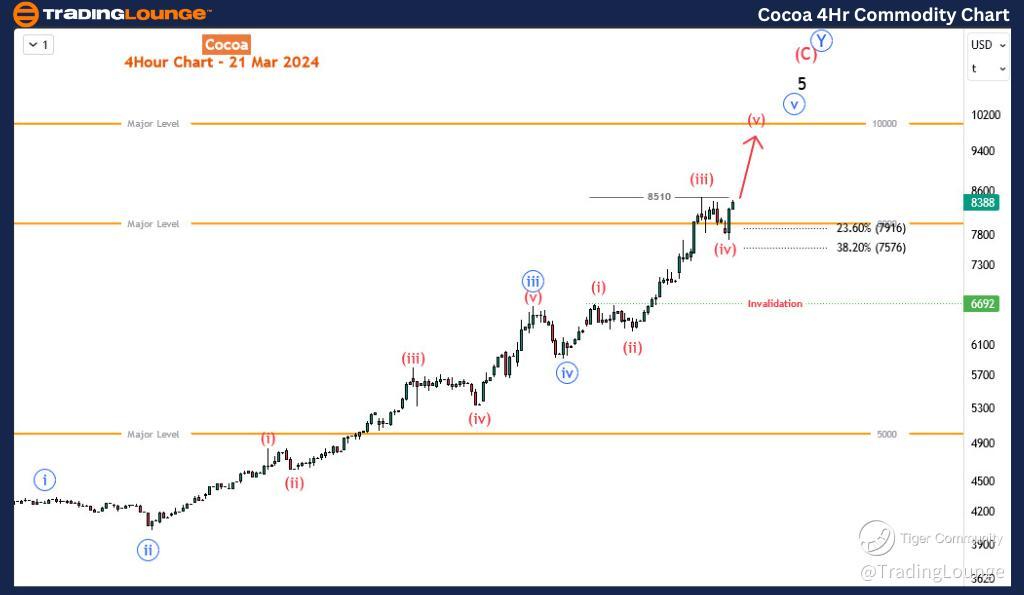
On the H4, blue wave ‘v’ (circled) has completed its sub-wave (iv). Wave (v) has emerged and should break above $8510 high toward the 9500 target and even the $10,000 major level. Will there be a bigger pullback from there or the trend will extend higher? The price action afterwards will tell.
Technical Analyst: Sanmi Adeagbo.
Cocoa Elliott Wave analysis [Video]
Author

Peter Mathers
TradingLounge
Peter Mathers started actively trading in 1982. He began his career at Hoei and Shoin, a Japanese futures trading company.


