Cinco de Mayo NFP Moves Markets

Good Morning Traders,
As of this writing 4 AM EST, here’s what we see:
US Dollar: Jun. USD is Up at 98.640.
Energies: Jun Crude is Down at 46.12.
Financials: The June 30 year bond is Up 6 ticks and trading at 152.00.
Indices: The June S&P 500 emini ES contract is 21 ticks Lower and trading at 2392.50.
Gold: The April gold contract is trading Up at 1230.70. Gold is 38 ticks Higher than its close.
Initial Conclusion
This is not a correlated market. The dollar is Up+ and crude is Down- which is normal and the 30 year bond is trading Higher. The Financials should always correlate with the US dollar such that if the dollar is lower then bonds should follow and vice-versa. The indices are Down- and Crude is trading Up+ which is correlated. Gold is trading Up+ which is not correlated with the US dollar trading Up+. I tend to believe that Gold has an inverse relationship with the US Dollar as when the US Dollar is down, Gold tends to rise in value and vice-versa. Think of it as a seesaw, when one is up the other should be down. I point this out to you to make you aware that when we don’t have a correlated market, it means something is wrong. As traders you need to be aware of this and proceed with your eyes wide open.
At this hour Asia is trading mainly higher with the exception of the Shanghai and Singapore exchanges. As of this writing all of Europe is trading to the downside.
Possible Challenges To Traders Today
– Mortgage Delinquencies. This is not major.
– Labor Market Conditions Index is out at 10 AM. This is not major.
– Lack of major economic news.
Treasuries
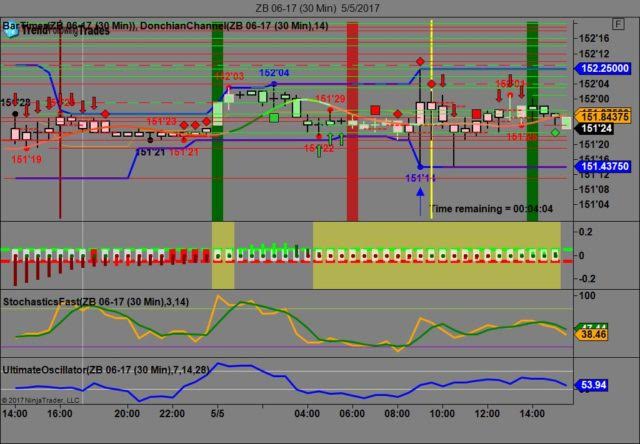
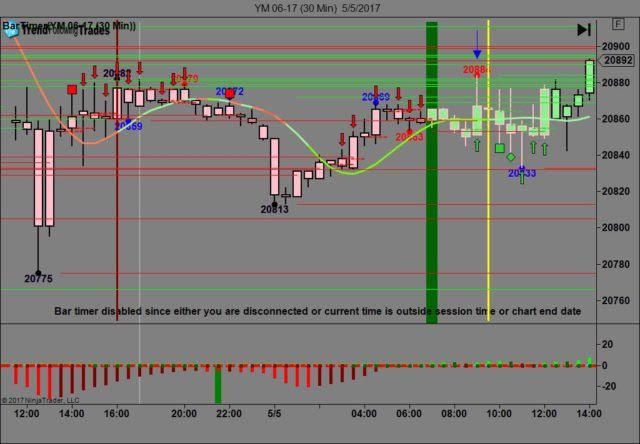
We’ve elected to switch gears a bit and show correlation between the 30 year bond (ZB) and The YM futures contract. The YM contract is the DJIA and the purpose is to show reverse correlation between the two instruments. Remember it’s liken to a seesaw, when up goes up the other should go down and vice versa.
On Friday the ZB made it’s move at around 9 AM after Non Farm Payrolls was reported. The ZB hit a low at around that time and the YM hit a high. If you look at the charts below ZB gave a signal at around 9 AM and the YM was moving lower at the same time. Look at the charts below and you’ll see a pattern for both assets. ZB hit a low at around 9 AM and the YM hit a high. These charts represent the newest version of Trend Following Trades and I’ve changed the timeframe to a 30 minute chart to display better. This represented a long opportunity on the 30 year bond, as a trader you could have netted about 20 plus ticks per contract on this trade. Each tick is worth $31.25. We added a Donchian Channel to the charts to show the signals more clearly.
Charts Courtesy of Trend Following Trades built on a NinjaTrader platform.
Bias
On Friday we gave the markets a neutral as it was Jobs Friday and we always maintain a neutral bias in that day. The Dow gained 55 points and the other indices gained ground as well. Today we aren’t dealing with a correlated market and our bias is to the downside.
Could this change? Of Course. Remember anything can happen in a volatile market.
Commentary
So another Jobs Friday has come and gone and the US economy created 211,000 new jobs versus 194,000 expected. Of course President Trump will claim credit for this and exclaim how messed up everything was until he came into office. The facts are that although this news is positive, the bulk of the jobs being created don’t pay a living wage by most standards and the U6 rate for the long term unemployed is at 8.6% which is still unusually high for an economy that has recovered. The pundits are now claiming that a rate increase is baked in for June but as in all things, only time will tell.
Author

Nick Mastrandrea
Market Tea Leaves


