China's Options

In the long run it is in the best interests of China and the United States to negotiate a trade deal.
China’s exports provide a large part of her economic growth and employment and replacing US markets is a near impossibility. Mainland goods give the US consumer excellent value and agricultural exports fill the coffers of politically important Midwestern farmers.
But the long run is an undefined variable when attempting to change a system that has given China a distinct advantages in trade and commerce founded in a long ago era of development.
It was never going to be easy for the US to change China’s behavior, particularly as every prior American administration settled for cosmetic agreements that failed to address the crucial problem of enforcement. The Trump White House is the first administration to try and it was almost inevitable that substantial economic pain would be required to convince the Chinese of the virtues of a different future.
One way to define the cost and perceived future cost of a prolonged tariff dispute between China and the United States is to look at their respective equity markets and currencies.
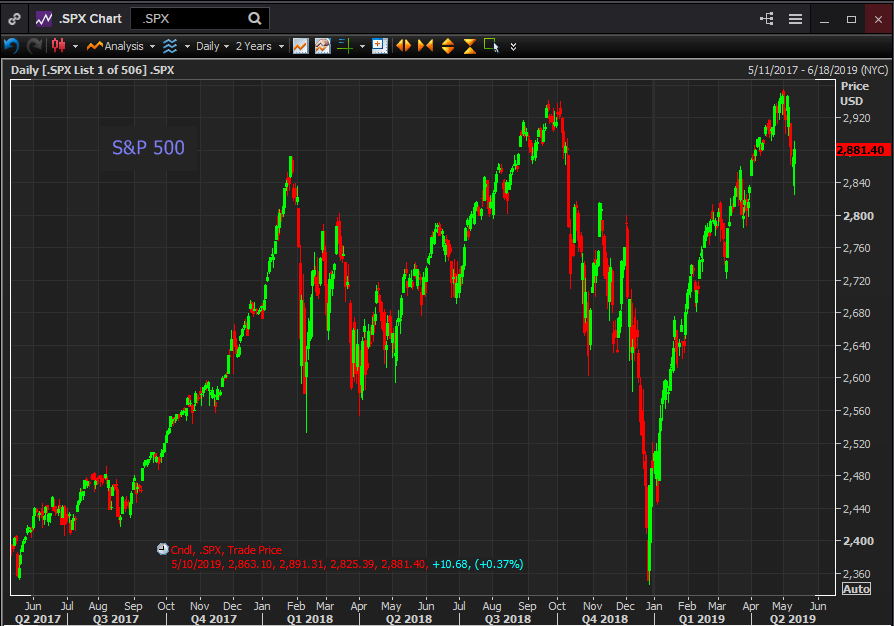
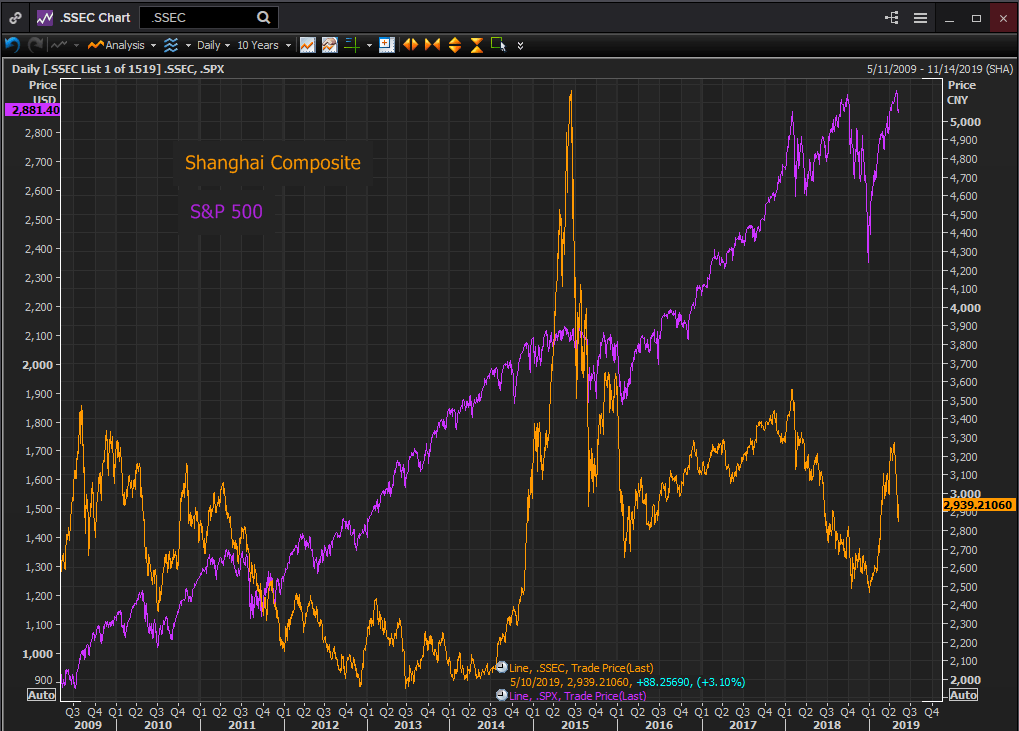
Since the trade confrontation began in earnest January 2018 the S&P 500 and the Shanghai Composite have taken very different paths (all quotations are closing prices as of Friday May 10th).
In late January 2018 the S&P index reached a then record of 2872.87. After a volatile year with the index falling as low as 2,581.88 on April 4th it scored another peak on September 21st at 2,929.67.
The prolonged collapse of equities in the fall of that year took the S&P down 19.7% to a finish of 2,351.10 on the day before Christmas. The return in the New Year has been even more dramatic and the index set a new record on April 30th at 2,945.83.
Reuters
Since the threat and imposition of additional tariffs by the United States at the close on Friday May 10th of 2,881.40 the average has lost 2.2%.
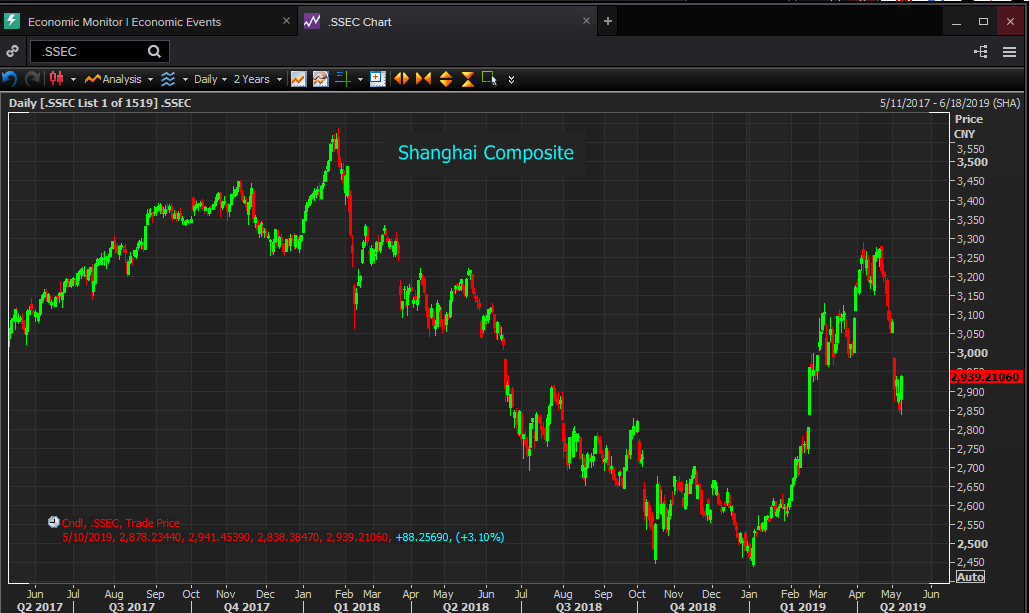
It is a very different story for the Shanghai Composite.
Its peak, aside from the massive bubble in 2015 at 5,166.35, which arose and vanished in six months, was in January last year at 3,558.13. The rest of 2018 was one long decline as the sparring over trade between the US and China and the setting of competing tariffs took an incessant toll. By January 2019 the Shanghai Composite has lost 30.7% to 2,465.29 on January 2nd.
The revival this year was a trade talk boom. As both sides voiced optimism and a deal seemed to be inching nearer the index soared to 3,270.79 on April 19th. That was an astonishing 32.7% above the January 2nd low in four months. The Chinese equity investors stand behind no one in their tolerance of volatility.
However, as the trade picture has soured the index plunged. From April 19th to May 9th it shed 12.8% in three weeks.
Reuters
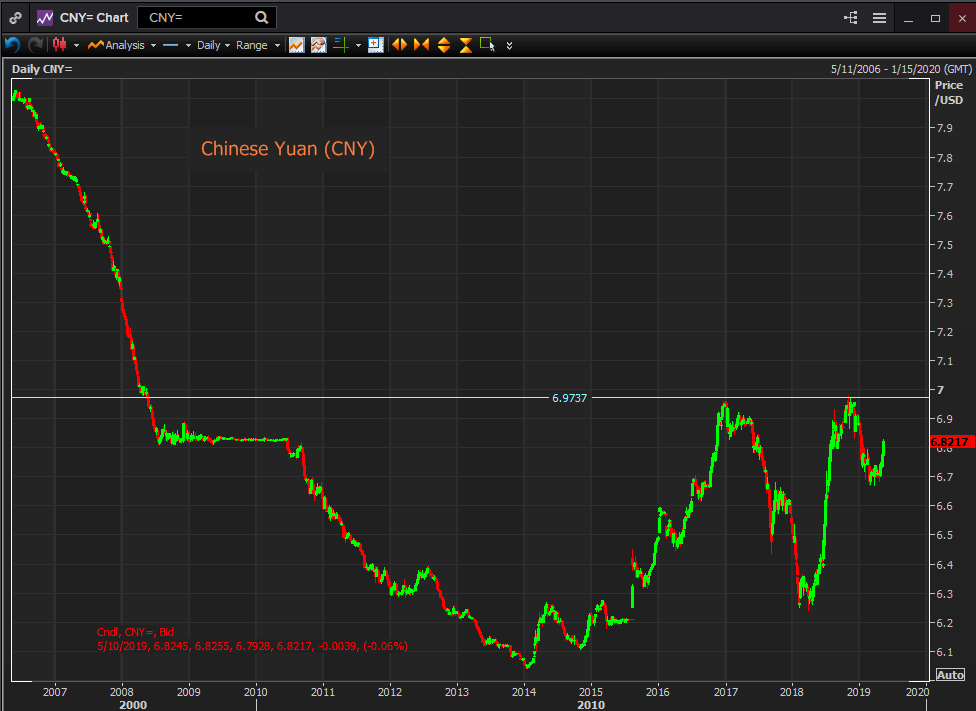
The comparison between the US Dollar and the Chinese Yuan (CNY) bears the same stamp.
As the trade conflict began early last year the Yuan began to devalue but it started from its strongest point since August 2015.
In the second half of 2017 the yuan had gained substantially against the dollar. From 6.9060 in the early part of May by February 7th 2019 the onshore Yuan (CNY) was trading at 6.2649, a 9.3% increase in nine months. The Yuan then dithered for six weeks as the opening fusillades of the conflict whistled through the markets.
When it became clear that the US was serious and intent on changing the basic trade equation the Yuan started to sink in earnest.
It is important to remember that the Yuan is a managed currency. Its movement is not the result of traders’ decisions but is the public expression of Chinese trade and monetary policy. Whatever conclusion the trade dispute will eventually offer the Chinese government was deliberately making the Yuan cheaper as a means of countering the US duties and as a notice to the Trump administration that both sides have trade weapons.
Reuters
From 6.2781 on March 27th the Yuan rocketed lower to 6.9330 on August 15th, a 10.4% devaluation. A further fall to 6.9737 by October 31st brought the total loss to 11.1% and the weakest the Yuan had been against the US currency since May 2008. Positive trade sentiment brought it back to 6.6844 on February 25th but the subsequent failures have returned it to 6.8217 with the largest fall the week of May 6th after the US threat to increase tariffs.
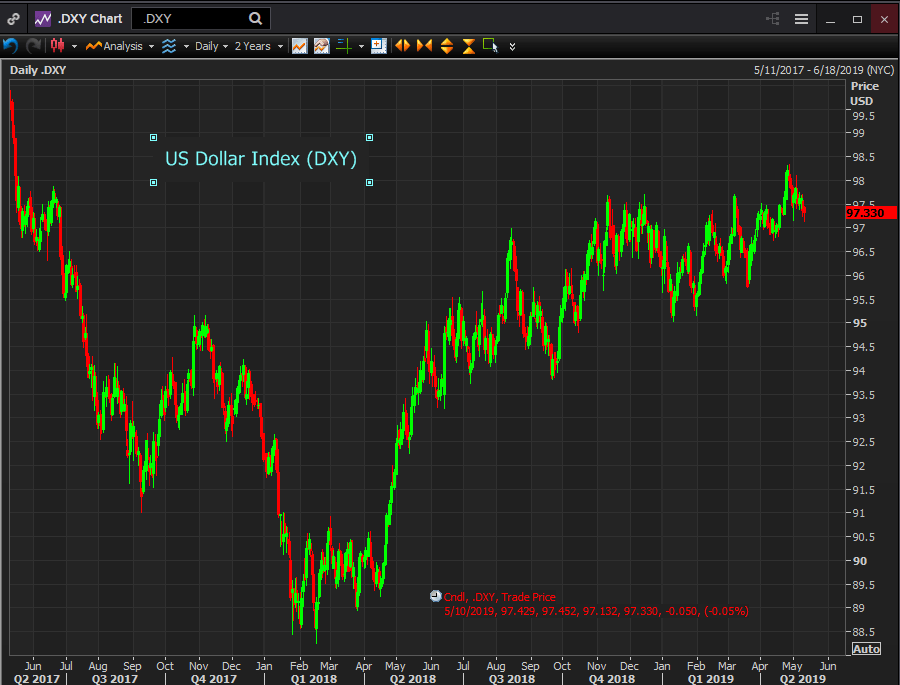
The US Dollar Index (DXY) has had no appreciable impact from the US/China trade dispute.
From a low in February 2018 of 88.59 the index moved higher throughout the year, to 96.69 on August 15th a 9.1% gain. A fall in late summer and a lunge higher brought the index to the year’s high of 97.54 on November 12th.
Reuters
The late year plunge in equites brought the DXY to 95.39 on January 10th but since then it has been a steady winner reaching 98.17 on April 24th. That is a 10.8% increase over the February 2018 low.
The market judgement could not be clearer on the domestic and the international stages. The sensitivity of the Yuan and the Shanghai Composite to the trade issue with the United States is graphic.
Reuters
For the Chinese investor confidence is heavily dependent on the outcome of the US argument. The Composite is 16% above its post-bubble low of 2465.29on January 2nd, a level that stemmed from the trade dispute and its effect on the mainland economy.
A breakdown in the trade talks with the promise of a long and painful bout of tariffs and export shrinkage might well drive the Shanghai Composite back to the range of 2013 and 2014.
The deliberate devaluation of the Yuan in the face of US trade pressures is a warning to the US but it is a weak one. American consumers will have to pay a bit more for many Chinese sourced products but they will have no problems finding alternatives. China’s hard won position as the workshop and assembly shop for many global industries is already under competitive threat. A prolonged trade war, if it comes to that, will speed up the shift of existing manufacturing elsewhere and make new foreign investment far less likely.
It is difficult to know how much influence domestic investor opinion has on the Politburo Standing Committee in Beijing but whatever there is can only press for an agreement with the United States.
Author

Joseph Trevisani
FXStreet
Joseph Trevisani began his thirty-year career in the financial markets at Credit Suisse in New York and Singapore where he worked for 12 years as an interbank currency trader and trading desk manager.


