Chart of the Week: USD/CAD bearish prospects
- USD/CAD traders are on the lookout for a fuller correction of the latest bullish impulse on the daily chart.
- A 38.2% Fibonacci retracement is a probability for the week ahead.

Risk markets ended the week on a firmer tone which weighed on the greenback and supported higher beta-fx, such as the Canadian dollar.
The loonie has managed to contain losses on the back of tapering expectations whereby the on-going recovery in Canada is no longer warranting the Bank of Canada’s massive balance sheet.
The following top-down analysis illustrates the downside prospects for the DXY as well as USD/CAD with a progress report on EUR/CAD's bearish thesis.
DXY daily chart
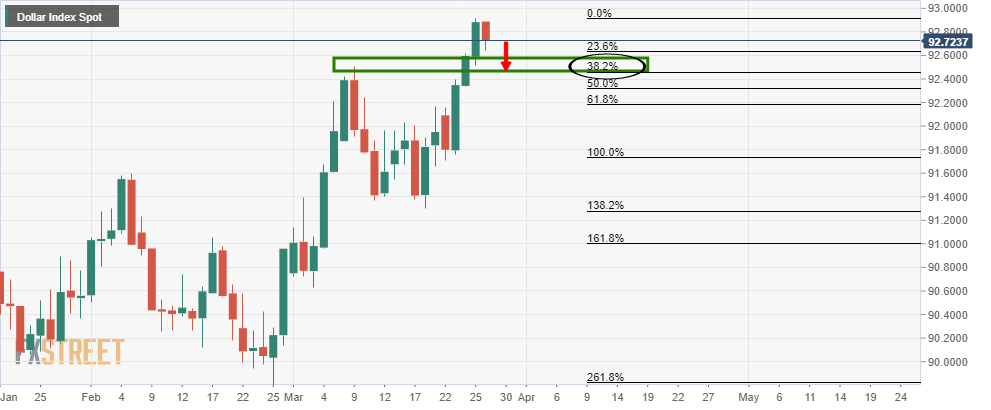
While the de-coupling between the EU and US is a supportive factor for the medium term, the US dollar's advance is stalling in the near-term.
This raises prospects of a sizeable correction back to test old resistance and a confluence of the 38.2% Fibonacci level for the immediate future.
USD/CAD, Daily chart
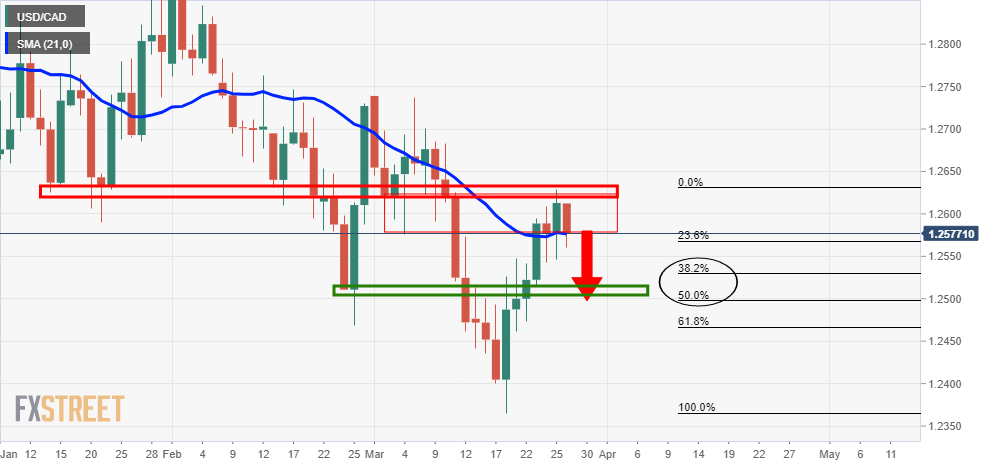
Meanwhile, against that backdrop, the loonie battled back to test the bull's commitments at the 21dsma and closed lower.
This leaves a bearish bias on the charts towards old support that meets resistance and a confluence of the 38.2% and 50% mean-reversion targets.
4-hour chart
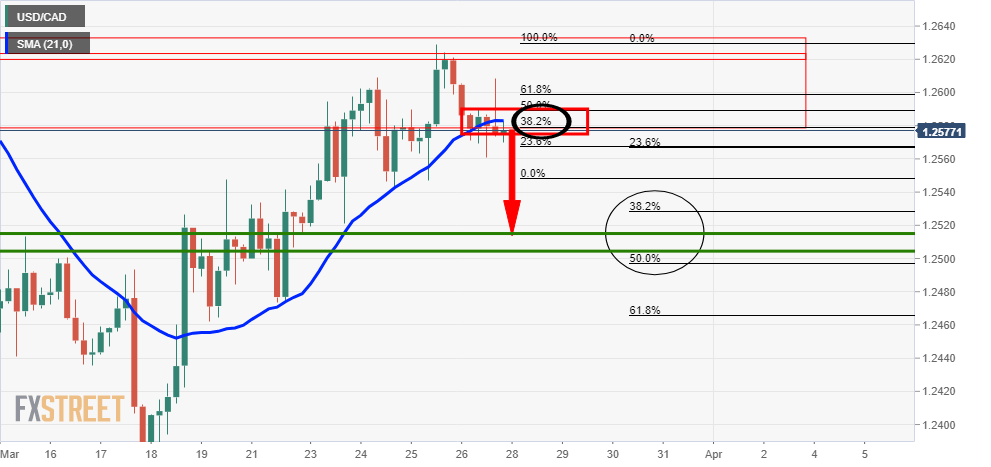
From a 4-hour perspective, the 21sma is acting as resistance at a 38.2% Fibo confluence area.
Hourly-chart
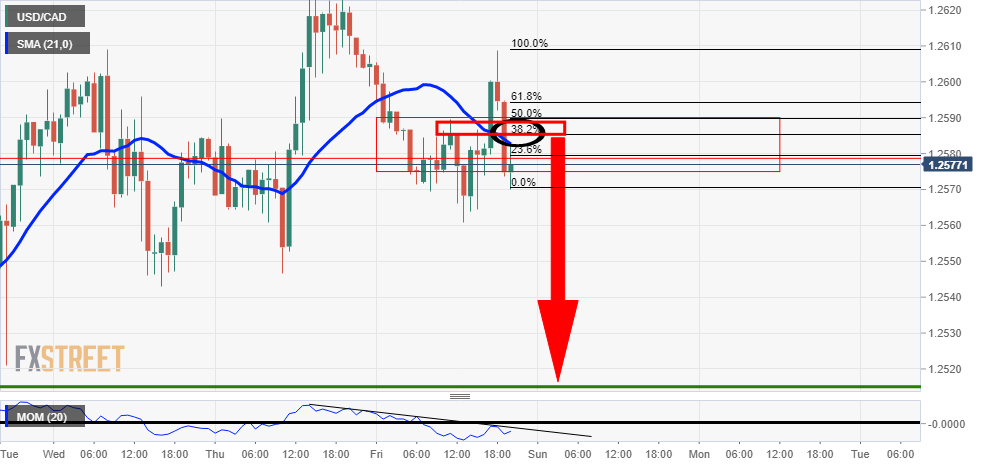
The hourly chart's Momentum is negative, although there are prospects of a bullish open to test the 38.2% Fibo of the latest hourly bearish impulse prior to a continuation to the downside.
Further reading, EUR/CAD breakeven
Meanwhile, staying with the bullish bias on the loonie, the prior analysis, EUR/CAD Price Analysis: Bears taking on bullish commitments at 1-hour support, there has been some choppy progress since the last update.
Prior progress daily & 1-hour charts
-637523142106027239.png)
As can be seen, the price is embarking on a downside extension and bears are riding the impulse towards a breakeven scenario.
-637523143100826127.png)
The conditions remain technically bearish and a break of the recent lows will trigger a breakeven position.
Live market, 1-hour chart
-637525604417116179.png)
The price printed a lower low since the last progress update but went on to form a W-formation which has already seen a 61.8% Fibonacci retracement of the bullish impulse to test the formation's neckline.
This exposes prospects of a re-test of the prior resistance.
This would be expected to hold, with the structure protecting the breakeven stop loss and attract supply towards the downside continuation target of the 1.4750s for the week ahead.
Author

Ross J Burland
FXStreet
Ross J Burland, born in England, UK, is a sportsman at heart. He played Rugby and Judo for his county, Kent and the South East of England Rugby team.