Chart of the Week, Gold: XAU/USD on verge of a 38.25% Fibo correction
- Gold has run into resistance and a correction prior to the next bullish impulse would be expected for the open.
- Gold bulls have eyes set on a higher high for the week ahead following the restest of the critical structure.

As per the prior analysis, Chart of the Week, gold: XAU/USD bulls moving in, carving out bullish structure, the price rallied into the M-formation's neckline.
Gold, daily chart, prior analysis
The M-formation was a pattern identified in the prior analysis:
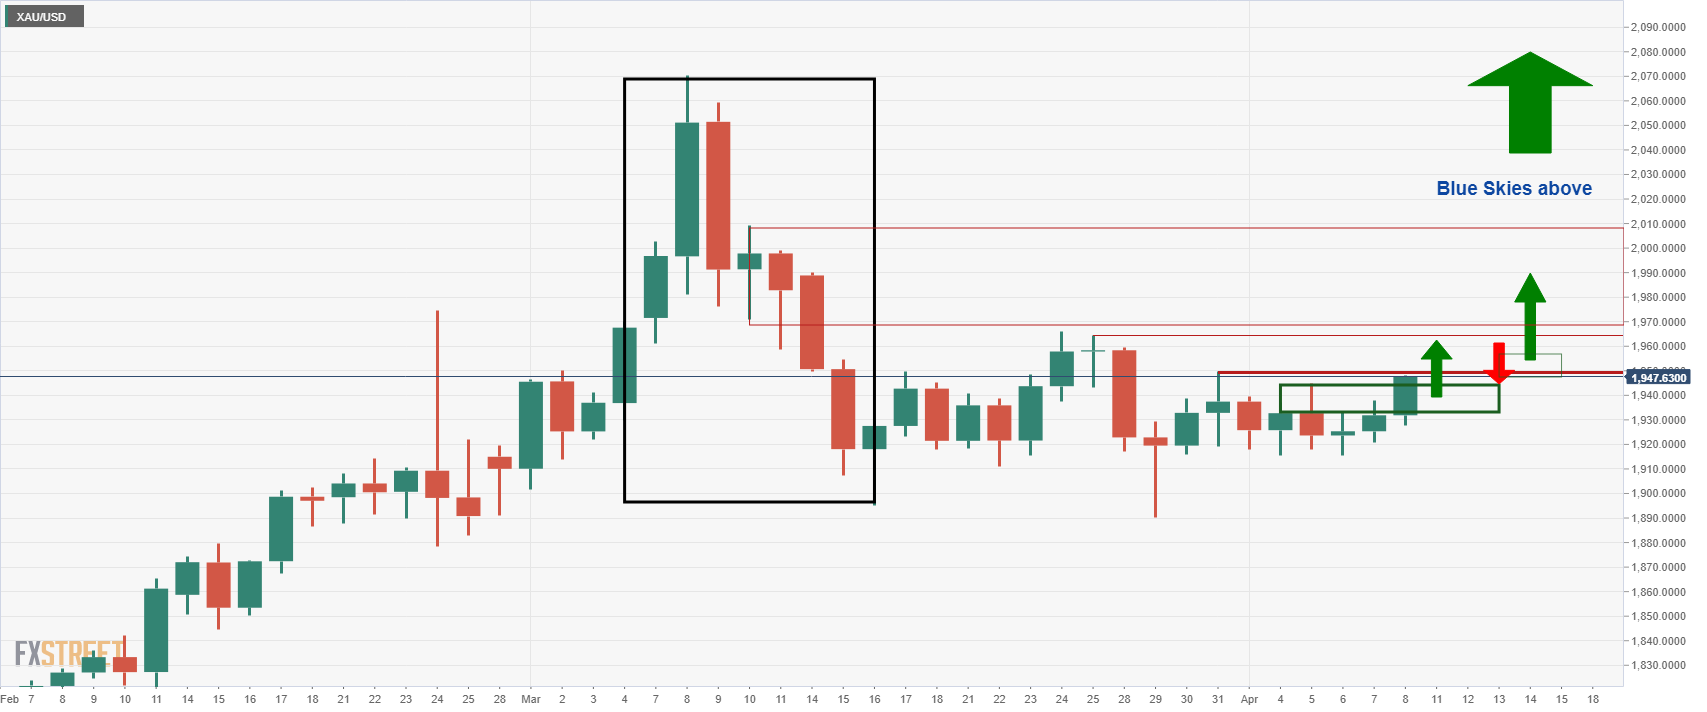
''This is a reversion pattern and the neckline of the formation would be expected to lure in the price. A break of the March 10 highs, near $2,010, will clear the path for 'blue skies'.''
Gold, live market
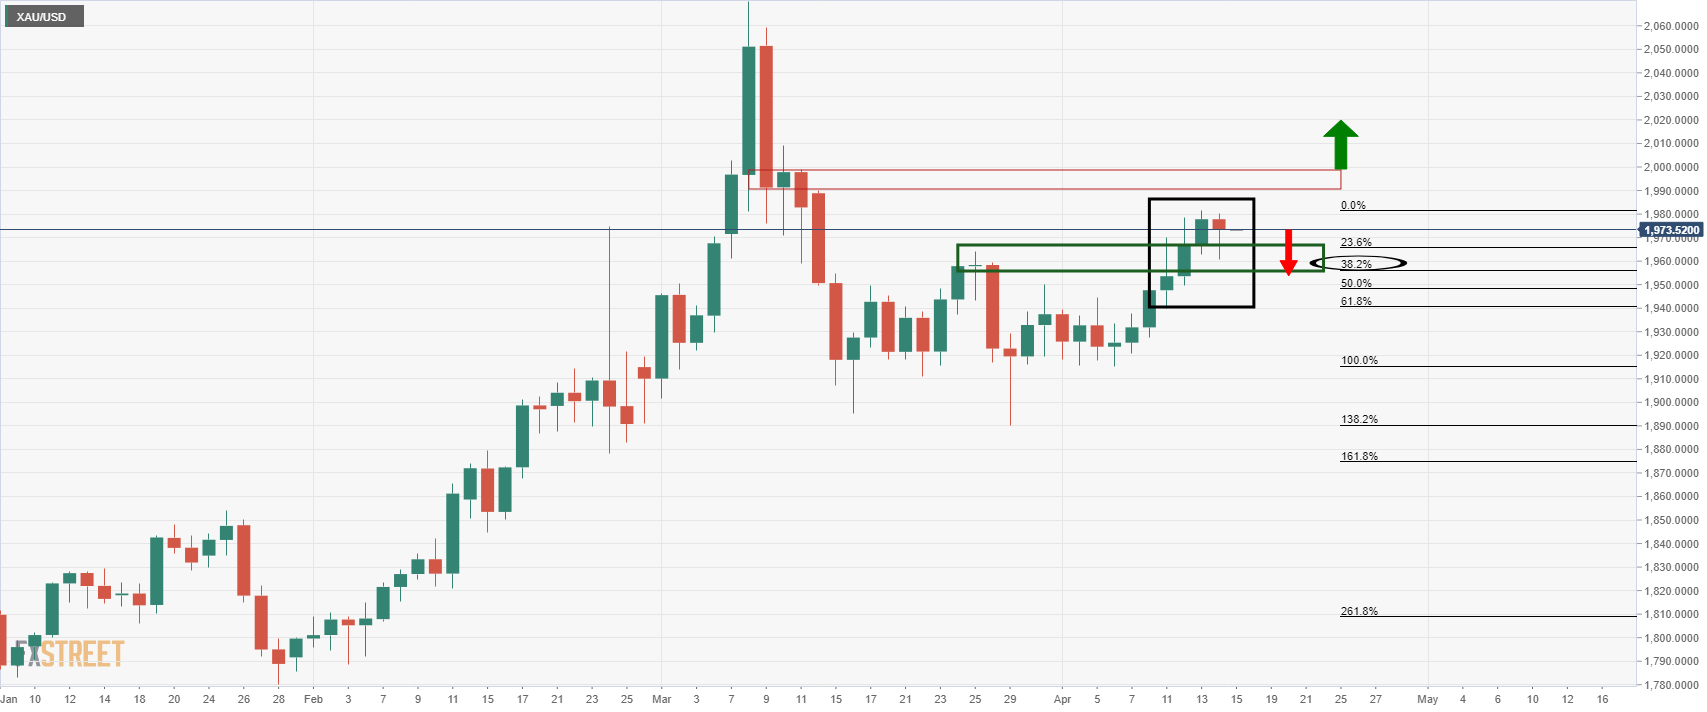
The price broke the consolidation highs and has rallied into the vicinity of the neckline area where is now stalling at. The 38.2% Fibonacci retracement level of the bullish impulse has a confluence with the prior highs and old resistance. This would be expected to be retested and if it were to hold, then a bullish continuation would be a high probability.
Gold, H4 chart
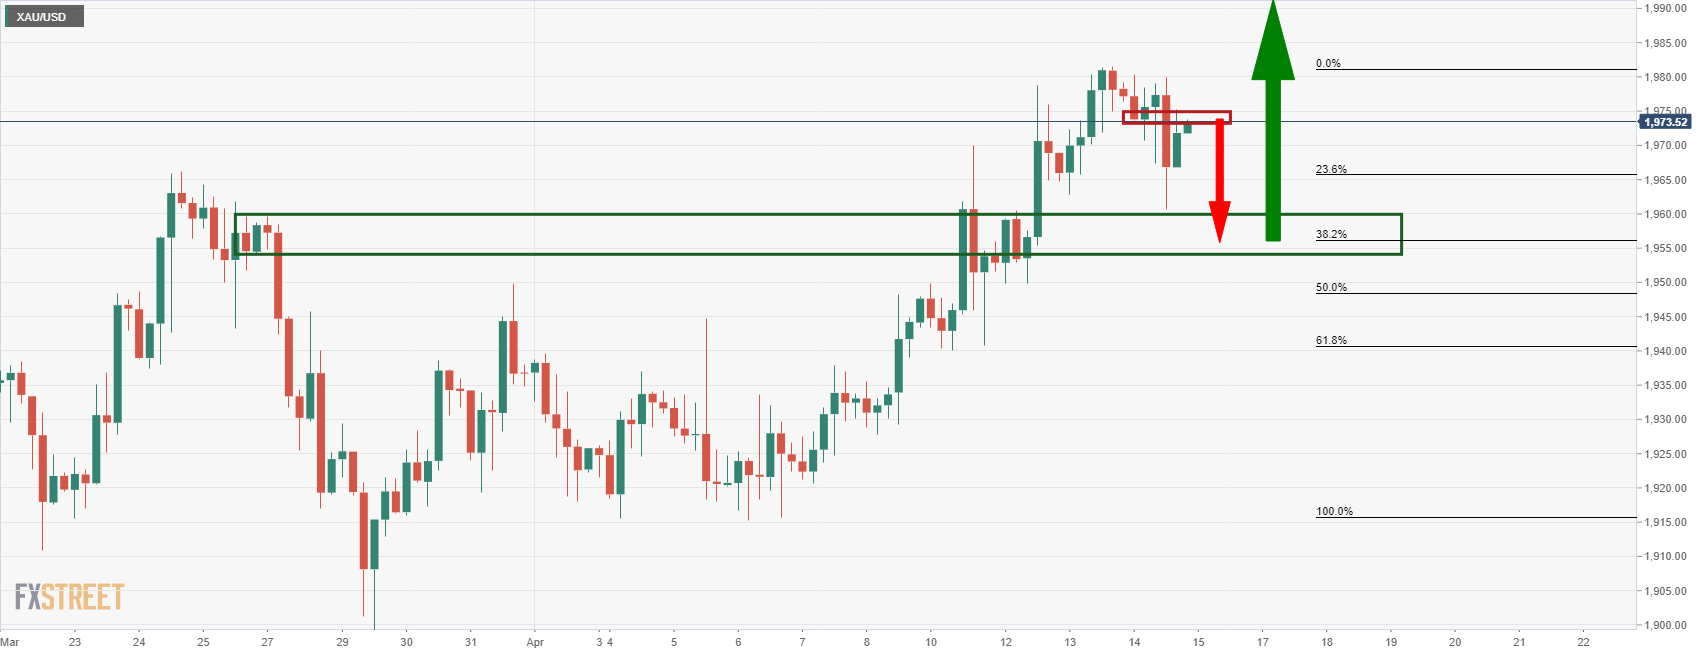
The price is retesting the neckline of the four-hour chart's M-formation. Failures to close above it would be expected to see a fuller correction to the 38.2% Fibo.
Premium
You have reached your limit of 3 free articles for this month.
Start your subscription and get access to all our original articles.
Author

Ross J Burland
FXStreet
Ross J Burland, born in England, UK, is a sportsman at heart. He played Rugby and Judo for his county, Kent and the South East of England Rugby team.


