Chart of the Week, gold: XAU/USD bulls moving in, carving out bullish structure
- Gold bulls are taking on the bears at critical resistance.
- A break of the $1,970s opens risk to the $2,010 key level.

As per the prior week's analysis, Chart of the Week, Gold: XAU/USD is pressured for the open, where the near term resistance was identified and highlighted as a significant feature of the daily chart, the bulls have moved in to challenge bear's commitments there. This leaves the outlook bullish for the week ahead, but a restest of the old resistance and bullish commitments will be needed to add conviction to the upside bias.
Gold, prior analysis, daily chart
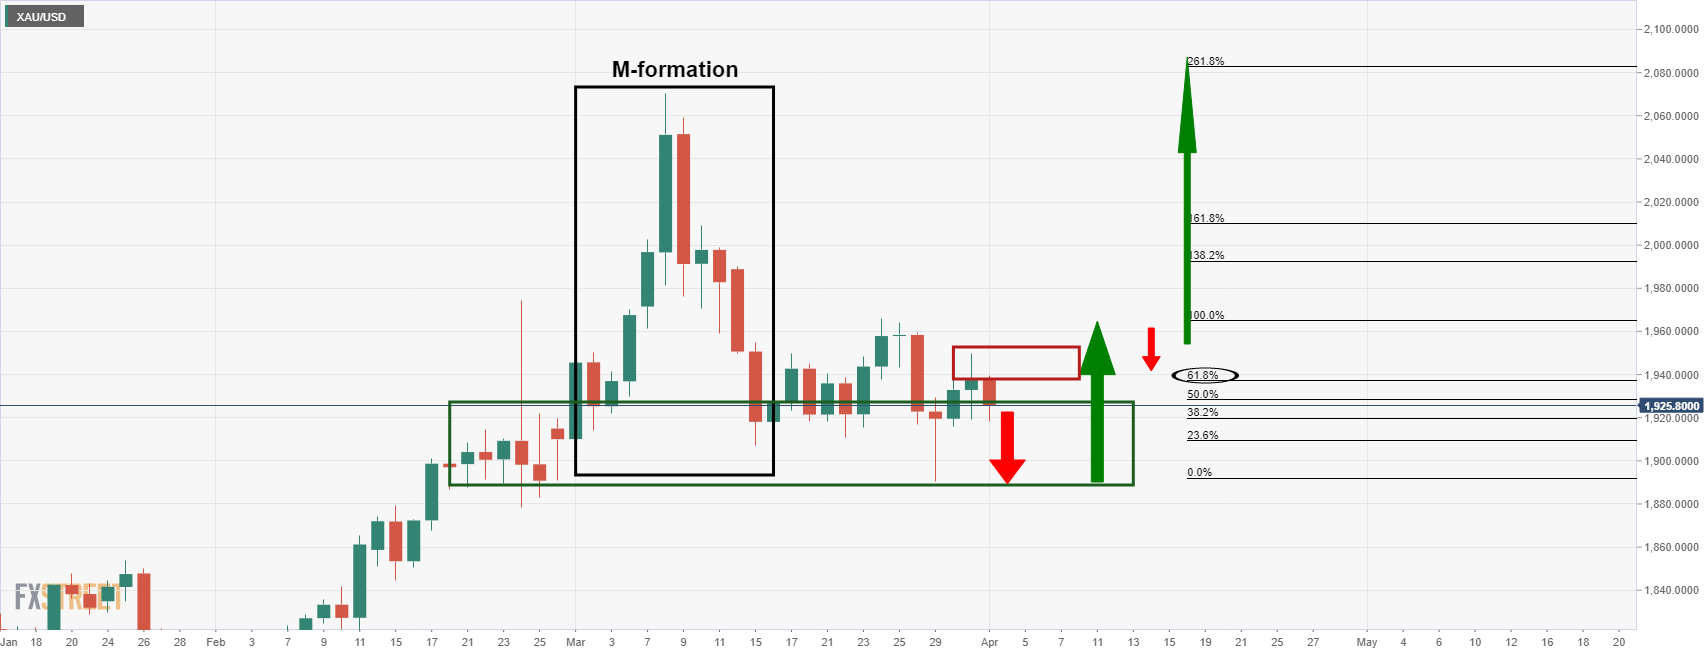
As per the chart above, the price of gold has gone on to test the resistance as follows:
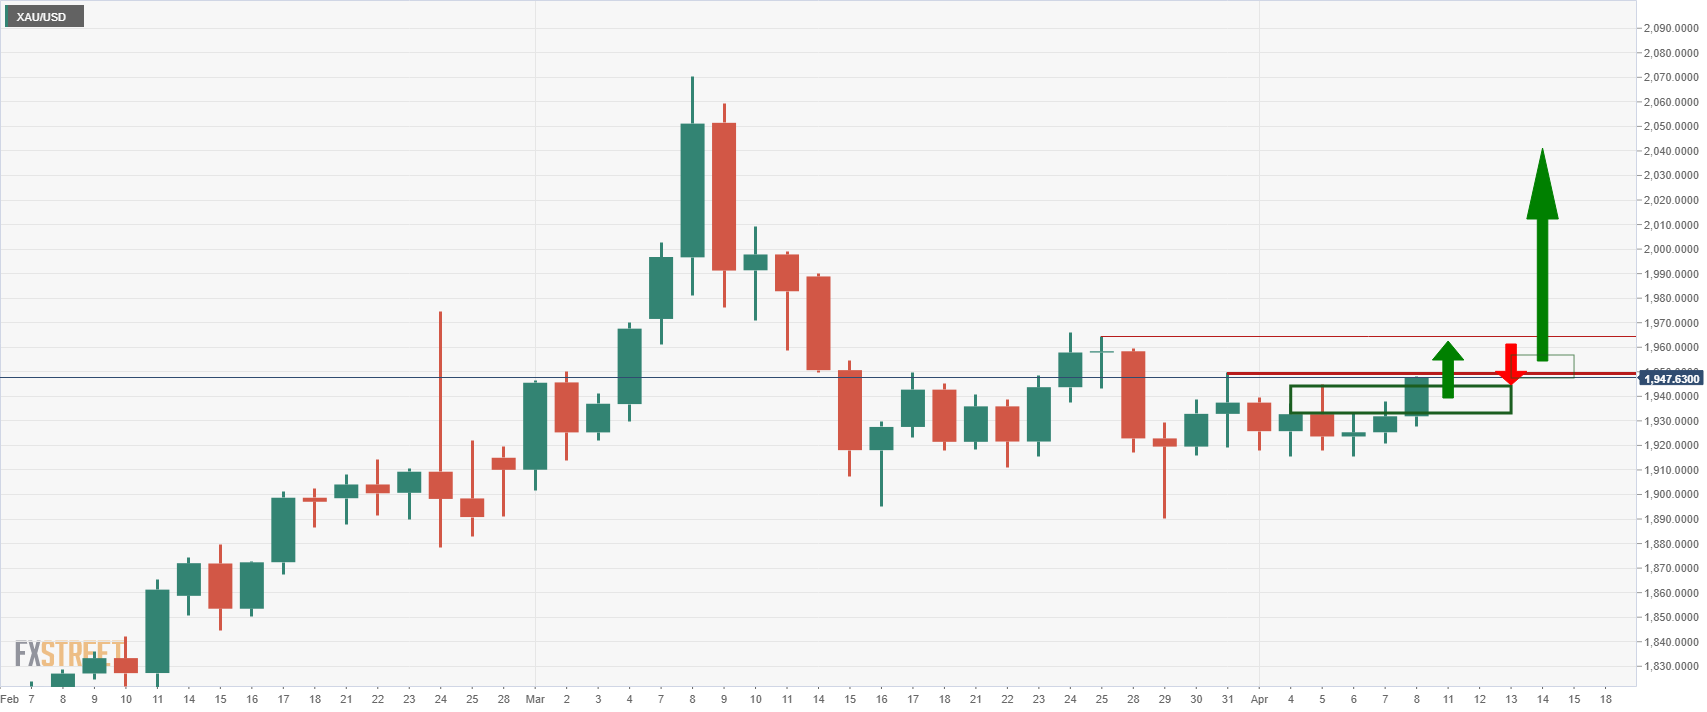
As illustrated, the price has broken newly formed resistance and is now testing the prior resistance. The bulls are in the running for a bullish start to the week and a break of the $1,970s will likely seal the deal for an upside extension for the week ahead.
The M-formation was a pattern identified in the prior analysis:
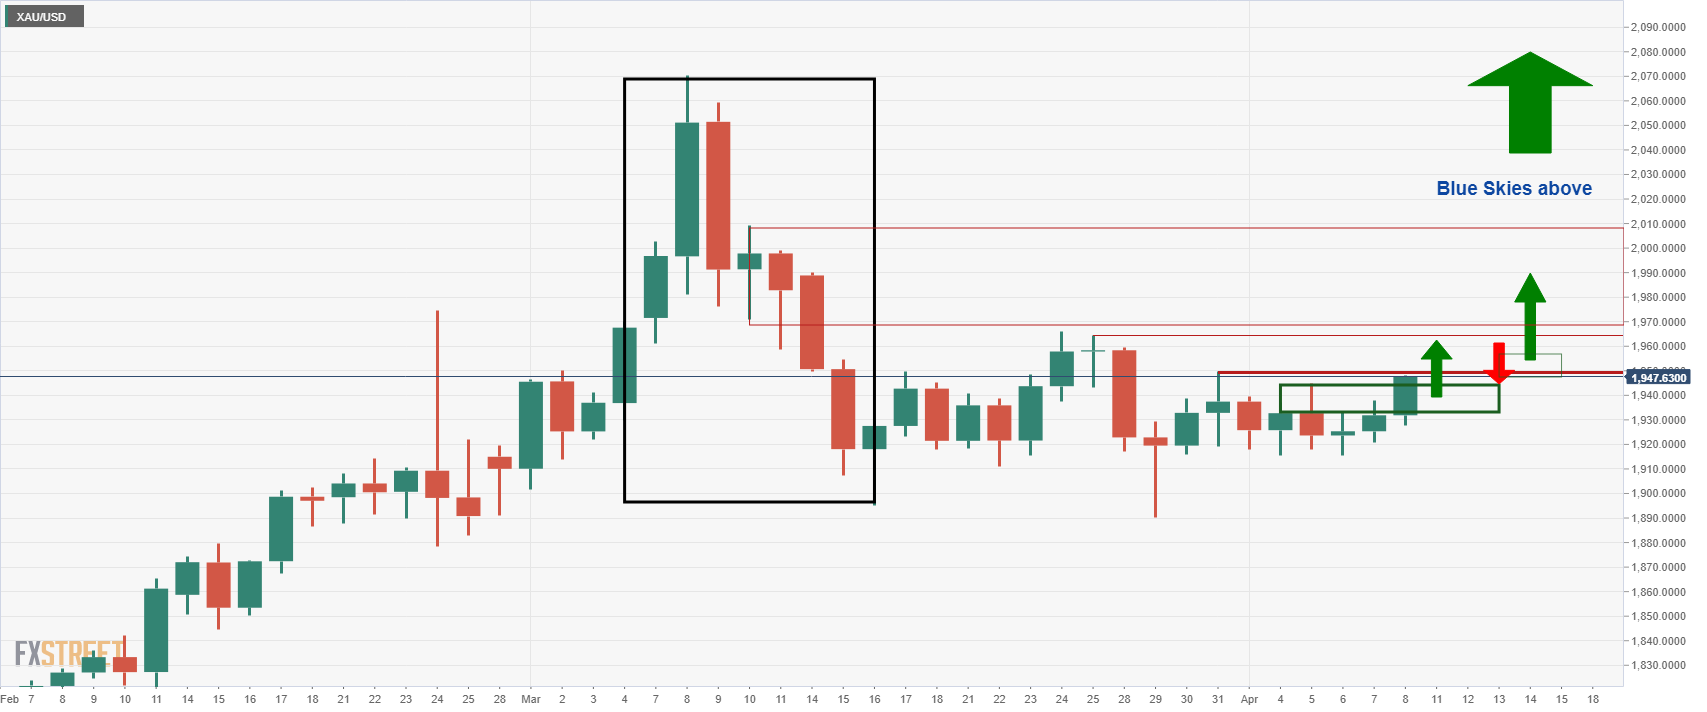
This is a reversion pattern and the neckline of the formation would be expected to lure in the price. A break of the March 10 highs, near $2,010, will clear the path for 'blue skies'.
Premium
You have reached your limit of 3 free articles for this month.
Start your subscription and get access to all our original articles.
Author

Ross J Burland
FXStreet
Ross J Burland, born in England, UK, is a sportsman at heart. He played Rugby and Judo for his county, Kent and the South East of England Rugby team.


