|premium|

Chart of the Week: Gold price reaches a wall of resistance

  • XAU/USD has been in the hands of the bulls as fundamentals ripen. 
  • The charts, on the other hand, may paint a different picture, at least in the meantime. 

Gold positions have got longer in both the futures and spot markets as the rate environment has become more favourable to the yellow metal as US nominal rates have started to trend lower which points to additional upward price pressure for XAU/USD. This means we should see additional short covering and new longs in the coming weeks.

A disappointing Nonfarm Payrolls report which has featured higher-than-expected wage increases and unemployment rates will likely see gold challenge technical resistance near $1,850/oz in the coming days or weeks.

This brings us to the charts. 

The following is a top-down analysis that illustrates the structure of the market across the main time frames.

Monthly chart

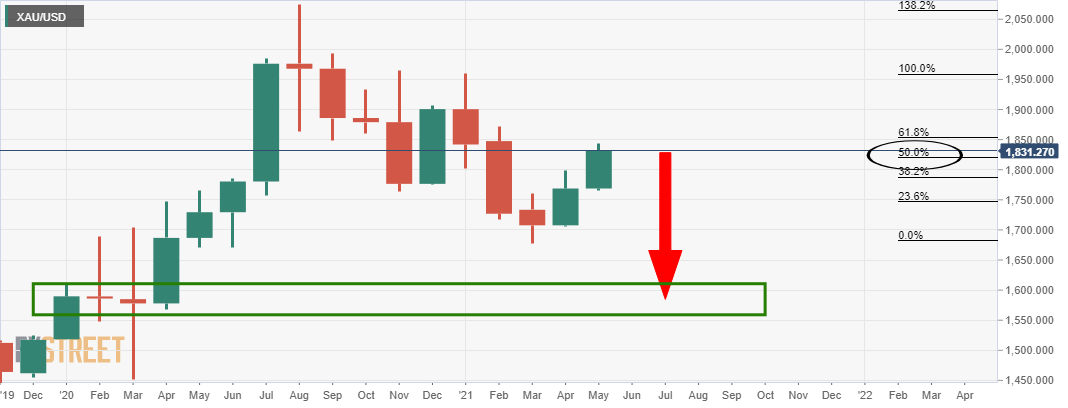
While the fundamental bias is to the upside, the monthly chart still has some work to do before a convincing technical bullish case can be made.

The correction of the last bearish impulse is still too shallow at a 50% mean reversion. 

Weekly chart

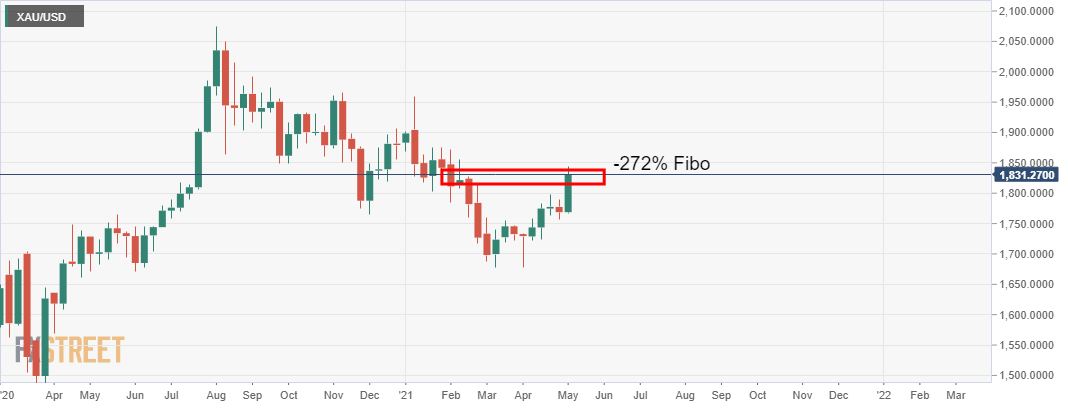
The weekly chart shows that the impulse has made a -272% Fibonacci retracement of the prior bullish impulse as it takes on resistance. 

Daily chart

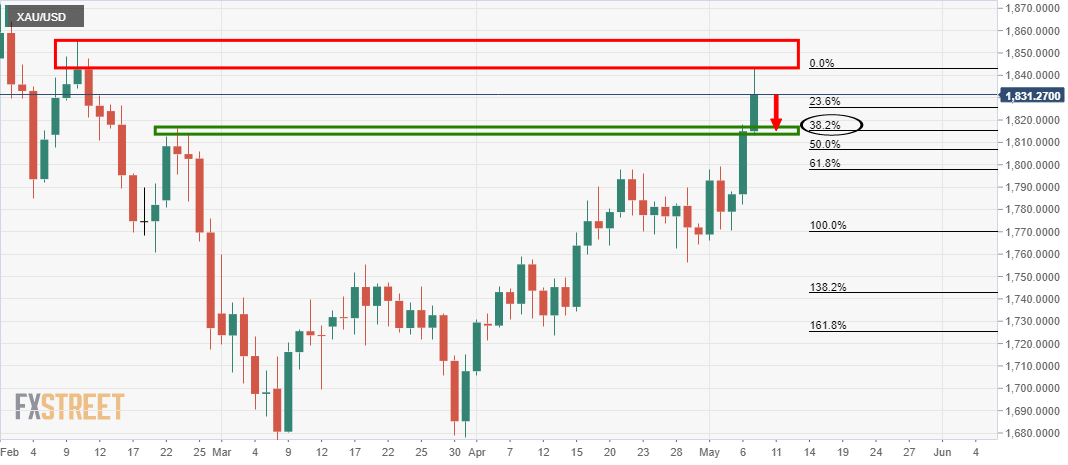
Meanwhile, there is scope for a deeper retracement on the daily chart to test the 38.2% Fibo of the prior daily impulse.

However, the bullish close is compelling, which leaves an upside continuation deeper into the supply zone on the cards for the opening session.

Premium

You have reached your limit of 3 free articles for this month.

Start your subscription and get access to all our original articles.

Subscribe to PremiumSign In

Author

Ross J Burland

Ross J Burland, born in England, UK, is a sportsman at heart. He played Rugby and Judo for his county, Kent and the South East of England Rugby team.

More from Ross J Burland
Share:

Editor's Picks

GBP/USD loses momentum, flirts with 1.3200

GBP/USD is struggling to maintain its positive bias on Thursday, retreating toward the 1.3200 region in response to the pick in the buying interest around the Greenback. That said, Cable remains under scrutiny as cautious market sentiment keeps investors focused on the US-Iran conflict and political effervescence in the UK.

EUR/USD trims gains, challenges 1.1400

EUR/USD now gives away part of its earlier advance, receding toward the 1.1400 contention zone on Thursday. Meanwhile, the pair’s recovery comes amid extra losses in the US Dollar, at the time when while investors continue to monitor developments in the Middle East and sentiment surrounding global technology stocks.

Gold remains bid and close to $4,100

Gold accelerates its recovery and approaches the key $4,000 mark per troy ounce at the end of the week, adding to Thursday’s advance. However, expectations for a hawkish Fed remain steady and keep the yellow metal’s potential upside contained.

Crypto Today: Bitcoin at $60,000, Ethereum at $1,500, and XRP at $1 face a make-or-break test

Bitcoin (BTC), Ethereum (ETH), and Ripple (XRP) are trading in the red on Friday after three consecutive days of losses, testing their respective make-or-break support levels.

Week ahead – NFP report to challenge Dollar strength and the hawkish Fed

Dollar strength dominates markets, as the hawkish Fed overshadows geopolitics and lower oil prices. NFP week could drive September Fed hike expectations and boost market volatility. The euro lacks fresh bullish catalysts, all eyes on the preliminary inflation report and the ECB Forum.

Regime change: Inside Kevin Warsh's first move to make the Fed unreadable on purpose

The rate did not move. That was the least interesting thing about Kevin Warsh's first meeting in charge of the Fed. The FOMC held its benchmark at 3.50%-3.75% for the fourth straight meeting, exactly as priced, and then the new chair used his first press conference to dismantle the machinery the market has leaned on for a decade.