Chart of the Week: Gold price analysis, a bearish bias persists
- Gold is heading toward bearish conditions for the open.
- The longer-term outlook is bearish, according to the monthly structure.
- Bulls could come up for a final breath based on the daily outlook from critical support.

As per the prior analysis, Gold on verge of significant correction, the outlook remains bearish as the bulls come up for what could be potentially their last breath before the bears take over.
The following illustrates the downside thesis in a series of charts that include the monthly, weekly, daily and 4-hour time frame perspectives.
Monthly chart
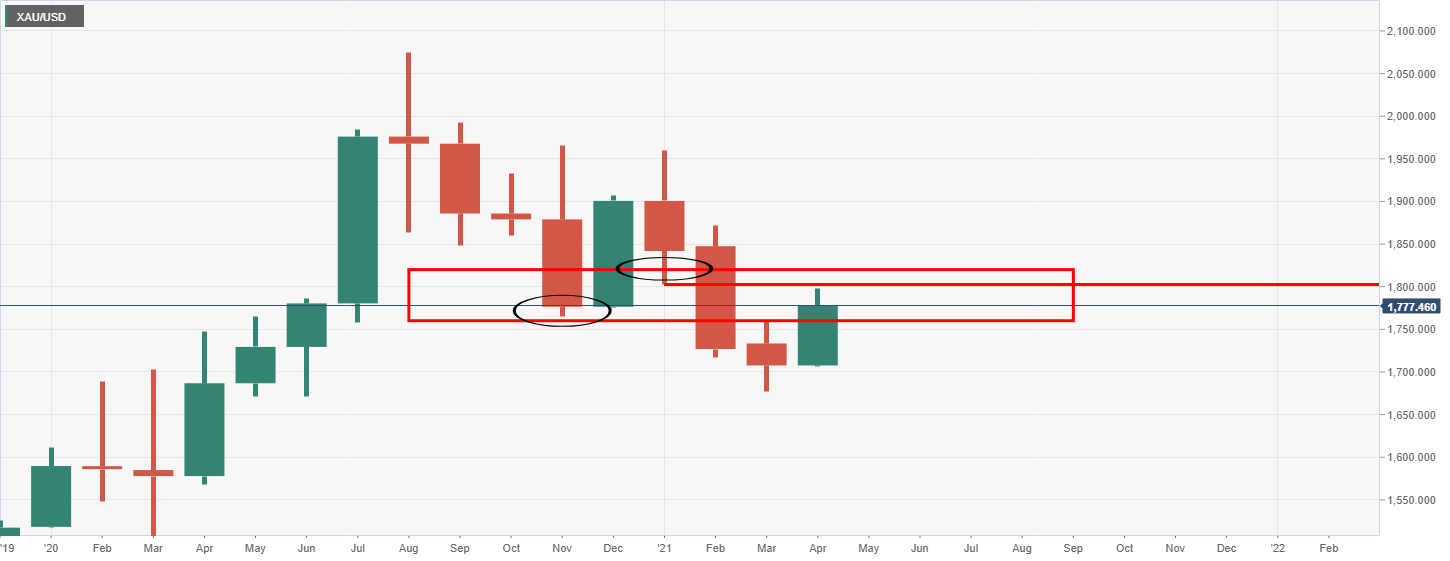
There is a week to go for the month of April, and the price is dangerously close to closing at or below the prior support of 1,802.
A test of and failures there or a close below here will be bearish for the forthcoming weeks ahead.
Weekly chart
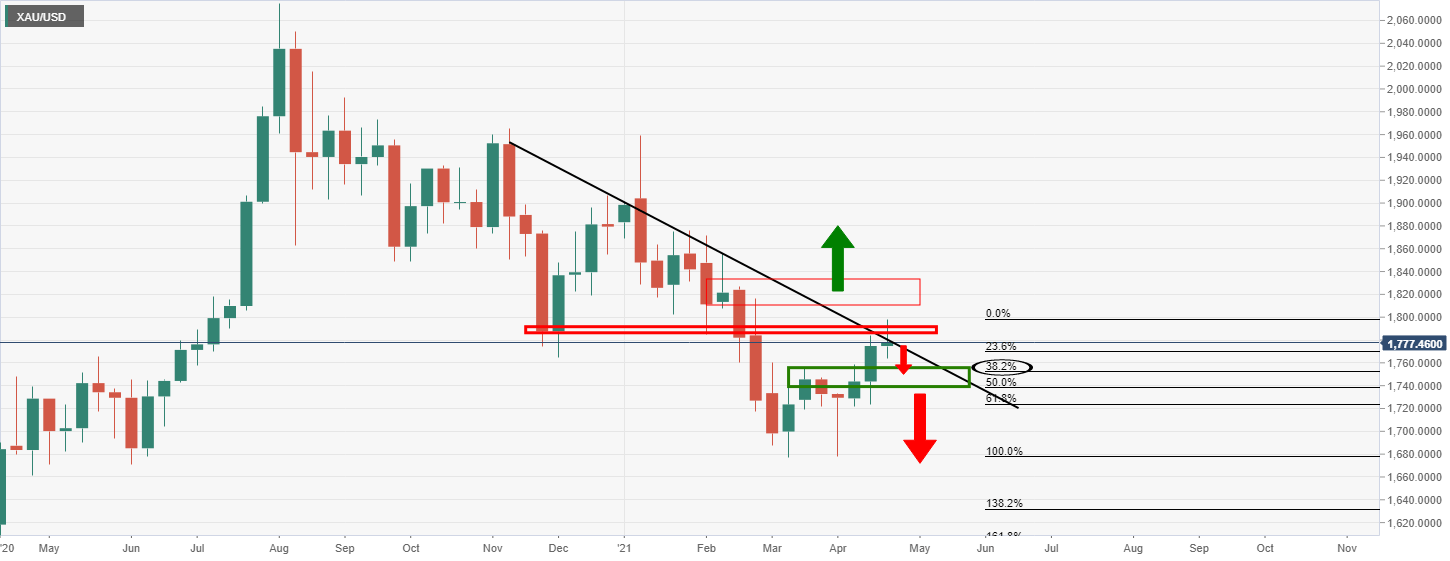
A break above the current resistance and dynamic trend line resistance would be neutral until a break of the December support candle.
However, at this juncture, the bias is to the downside from resistance to test at least the confluence of prior weekly resistance, expected to turn support, and a 38.2% Fibonacci retracement.
Daily chart
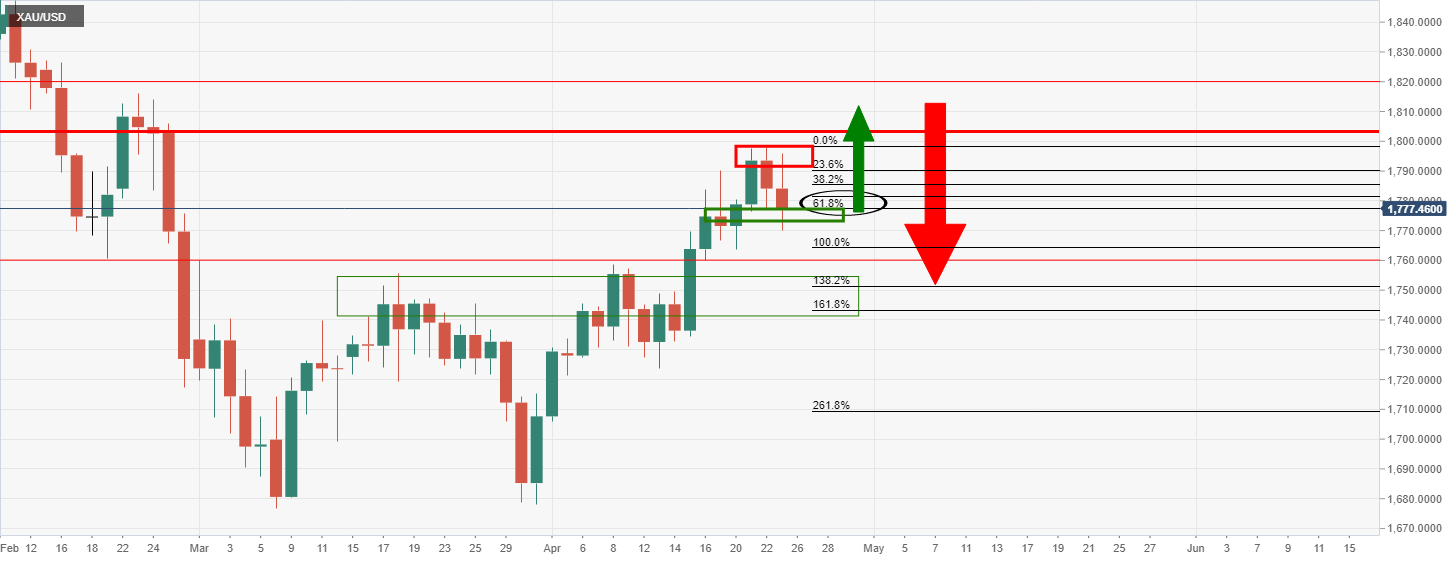
From a daily perspective, the price has failed at the downside, and although it penetrated some of the support, the bulls have stepped in and the price has closed at the 61.8% Fibo.
This puts the bulls in charge to open the week.. There are prospects of an advance through daily resistance to penetrate deeper into the monthly resistance.
However, failures at daily resistance or a break of support will underscore the bearish bias for the forthcoming days and weeks ahead.
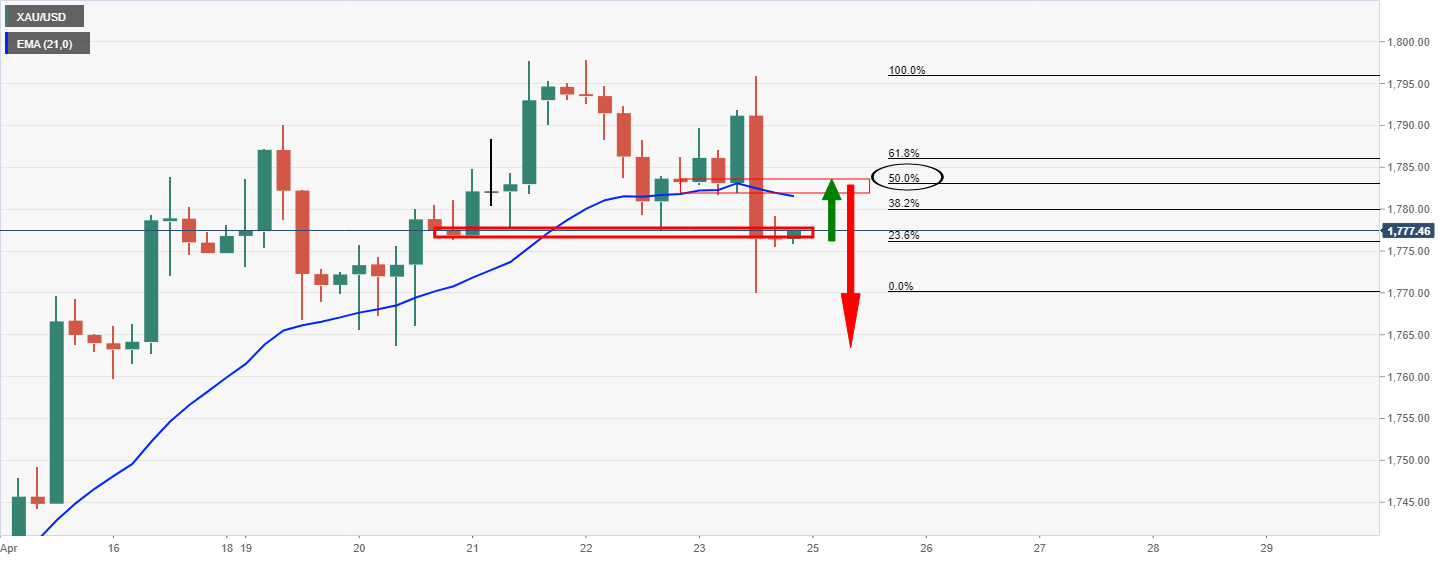
4-hour chart
The price is meeting 4-hour resistance and has already made a 23.6% Fibo retracement of the last bearish impulse.
A bearish open will pull the 8 EMA below the 21 EMA and make for bearish technical conditions in line with negative Momentum:
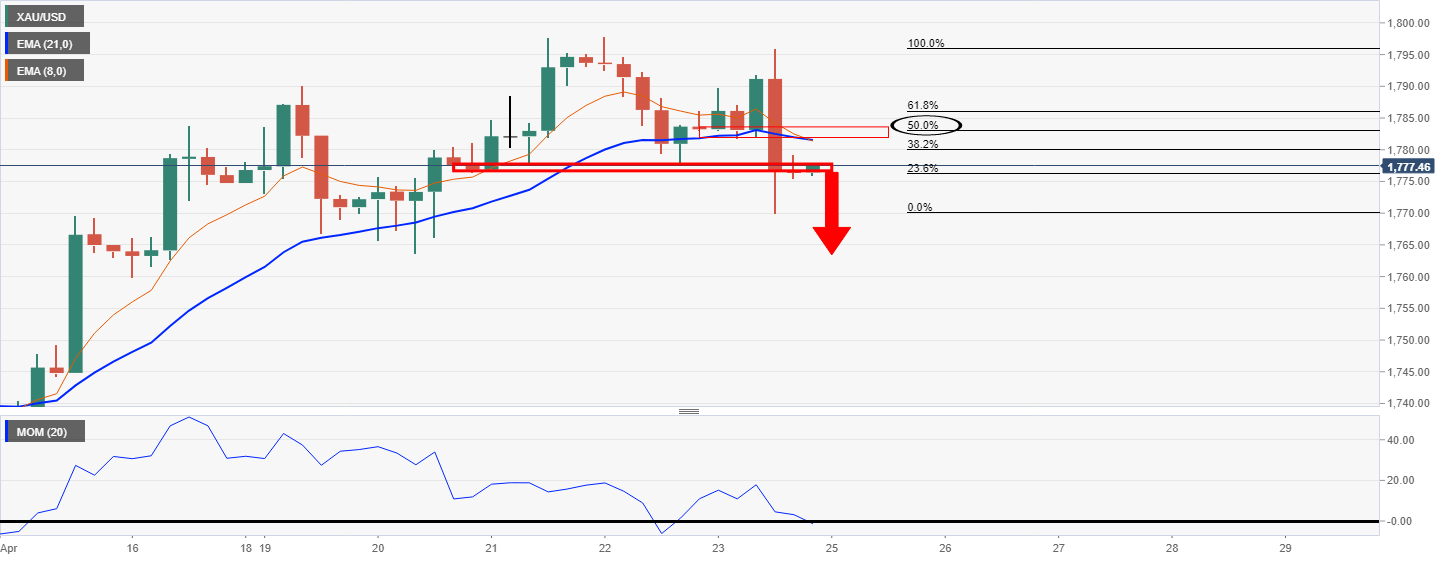
However, there is scope for a deeper test to higher resistance and the 21 EMA confluence with the 50% mean reversion target of the move for the open.
Premium
You have reached your limit of 3 free articles for this month.
Start your subscription and get access to all our original articles.
Author

Ross J Burland
FXStreet
Ross J Burland, born in England, UK, is a sportsman at heart. He played Rugby and Judo for his county, Kent and the South East of England Rugby team.


