• Gold is struggling to convince on the upside. 
  • A bearish correction could be on the cards for the week ahead. 

The price of gold is interesting at this juncture as it dips its toe in supply territory, just as the DXY meets a critical support area.

Moreover, a wider measure of dollar positioning shows that the greenback posted a net short position of $5.71 billion this week, from net shorts of $7.75 billion the week before.

There is still plenty of appetite for the greenback out there, which will be a headwind for gold prices in the medium term. 

Gold price analysis

Let us move over to the gold charts.

The following is a top-down analysis that illustrates prospects for the next downside opportunity on gold:

Gold monthly chart

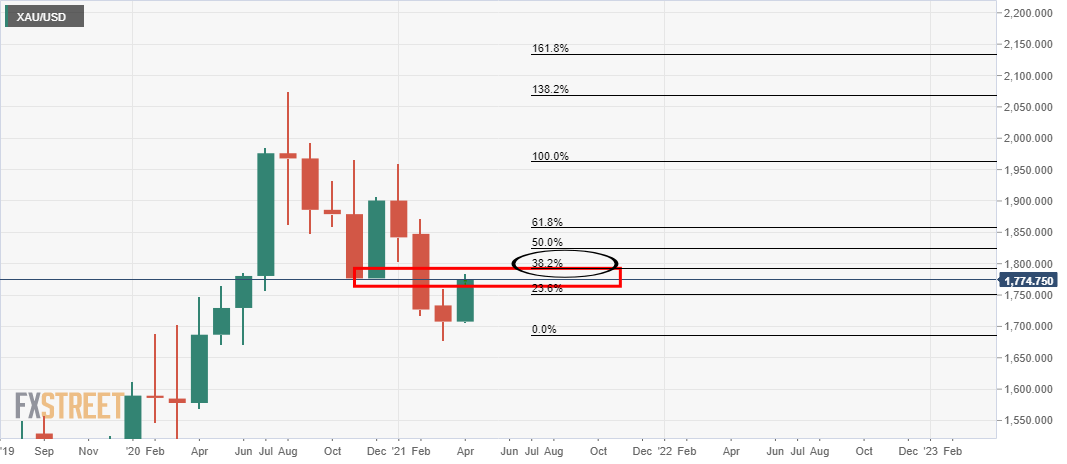
The price has corrected toward a 38.2% Fibonacci retracement of the last series of bearish candles. 

The correction is significant as it meets prior support that would now be expected to act as resistance. 

Therefore, the outlook is bearish. 

Weekly chart


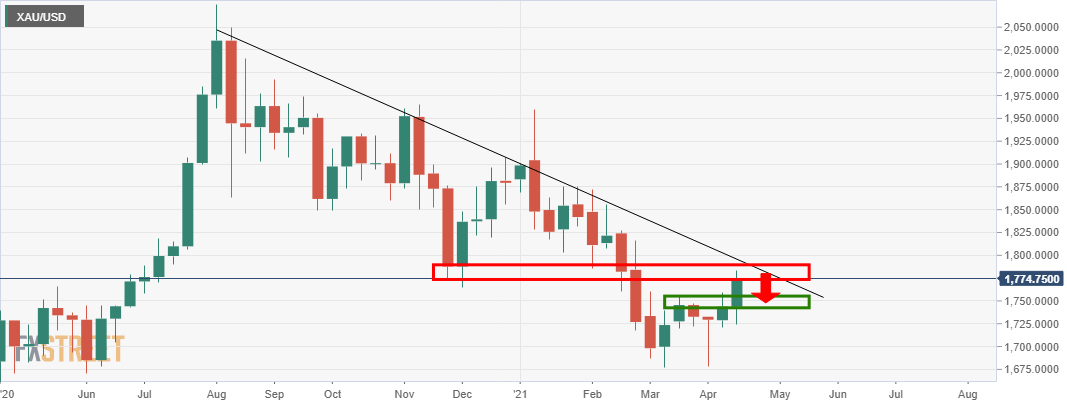
The price is on the approach to the dynamic weekly resistance line. 

Bulls are now testing the bearish commitments from prior weekly support, which would be expected to now act as a resistance area. 

While there is definitely room for an upside extension for the week ahead to penetrate deeper into supply and fully test the resistance line, the path of least resistance, at this juncture, is to the downside. 

Traders can monitor the lower time frames for bearish structure and to sell from resistance. 

Daily chart

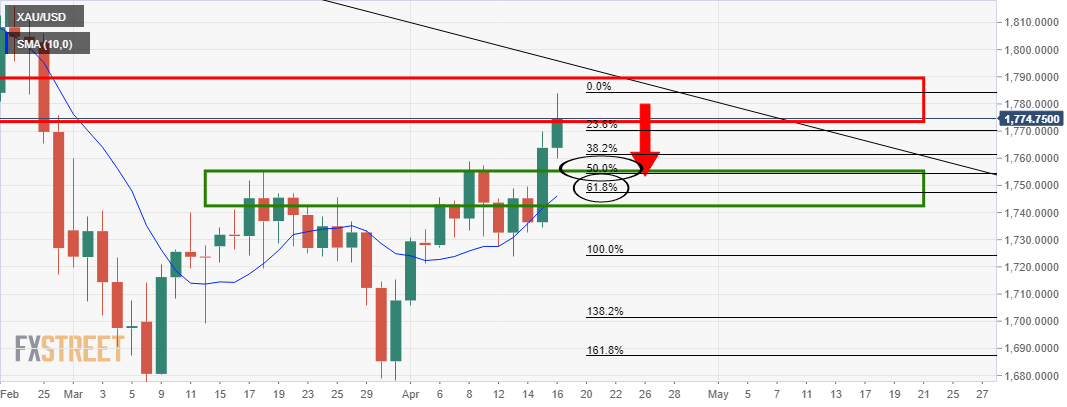
The daily chart has seen a bullish close, and there is room to go on the upside yet. 

With that being said, the prior highs looking left have a confluence with a 50% mean reversion of the last few sessions of bullish closes. 

A deeper 62% retracement will meet with the 21-day EMA  and the neckline of the W-formation.

1-hour chart

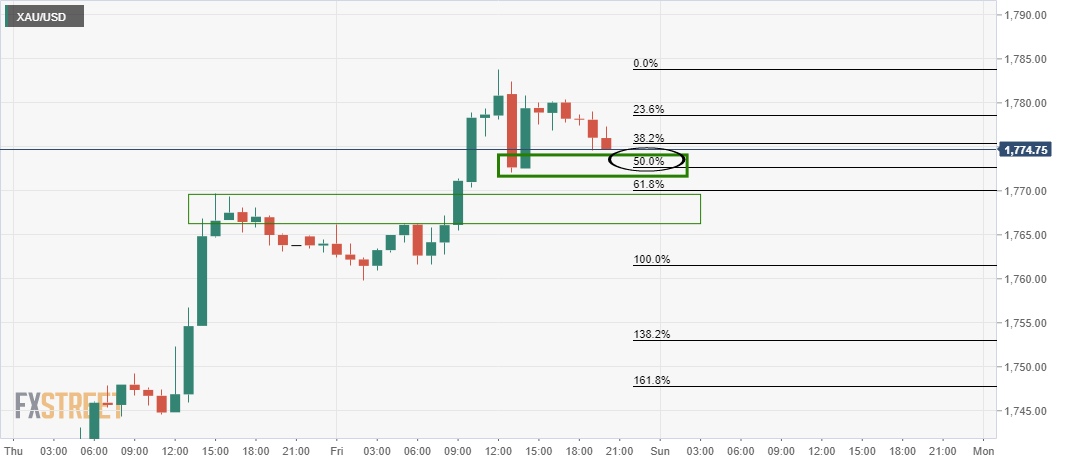
Meanwhile, the hourly conditions have shown that the price has failed in a double top scenario, and a break below the 50% mean reversion mark would be significant for the opening sessions of the week ahead. 

This would signal that the bears are taking control with the intent of breaking to the downside at the start of what would be expected to be a far bigger correction toward the daily aforementioned targets.


Information on these pages contains forward-looking statements that involve risks and uncertainties. Markets and instruments profiled on this page are for informational purposes only and should not in any way come across as a recommendation to buy or sell in these assets. You should do your own thorough research before making any investment decisions. FXStreet does not in any way guarantee that this information is free from mistakes, errors, or material misstatements. It also does not guarantee that this information is of a timely nature. Investing in Open Markets involves a great deal of risk, including the loss of all or a portion of your investment, as well as emotional distress. All risks, losses and costs associated with investing, including total loss of principal, are your responsibility. The views and opinions expressed in this article are those of the authors and do not necessarily reflect the official policy or position of FXStreet nor its advertisers. The author will not be held responsible for information that is found at the end of links posted on this page.

If not otherwise explicitly mentioned in the body of the article, at the time of writing, the author has no position in any stock mentioned in this article and no business relationship with any company mentioned. The author has not received compensation for writing this article, other than from FXStreet.

FXStreet and the author do not provide personalized recommendations. The author makes no representations as to the accuracy, completeness, or suitability of this information. FXStreet and the author will not be liable for any errors, omissions or any losses, injuries or damages arising from this information and its display or use. Errors and omissions excepted.

The author and FXStreet are not registered investment advisors and nothing in this article is intended to be investment advice.

Recommended Content


Recommended Content

Editors’ Picks

AUD/USD failed just ahead of the 200-day SMA

AUD/USD failed just ahead of the 200-day SMA

Finally, AUD/USD managed to break above the 0.6500 barrier on Wednesday, extending the weekly recovery, although its advance faltered just ahead of the 0.6530 region, where the key 200-day SMA sits.

AUD/USD News

EUR/USD met some decent resistance above 1.0700

EUR/USD met some decent resistance above 1.0700

EUR/USD remained unable to gather extra upside traction and surpass the 1.0700 hurdle in a convincing fashion on Wednesday, instead giving away part of the weekly gains against the backdrop of a decent bounce in the Dollar.

EUR/USD News

Gold keeps consolidating ahead of US first-tier figures

Gold keeps consolidating ahead of US first-tier figures

Gold finds it difficult to stage a rebound midweek following Monday's sharp decline but manages to hold above $2,300. The benchmark 10-year US Treasury bond yield stays in the green above 4.6% after US data, not allowing the pair to turn north.

Gold News

Bitcoin price could be primed for correction as bearish activity grows near $66K area

Bitcoin price could be primed for correction as bearish activity grows near $66K area

Bitcoin (BTC) price managed to maintain a northbound trajectory after the April 20 halving, despite bold assertions by analysts that the event would be a “sell the news” situation. However, after four days of strength, the tables could be turning as a dark cloud now hovers above BTC price.

Read more

Bank of Japan's predicament: The BOJ is trapped

Bank of Japan's predicament: The BOJ is trapped

In this special edition of TradeGATEHub Live Trading, we're joined by guest speaker Tavi @TaviCosta, who shares his insights on the Bank of Japan's current predicament, stating, 'The BOJ is Trapped.' 

Read more

Majors

Cryptocurrencies

Signatures