Chart of the Week: Gold on the approach to $1,855
- Gold bulls taking on monthly and weekly resistance.
- $1,850s are on the cards for the sessions ahead in the coming days.

As per the prior week's analysis, Chart of the Week: Gold price reaches a wall of resistance, the price of gold did indeed melt from a wall of resistance prior to attempting to move higher.
Prior analysis, weekly and daily charts
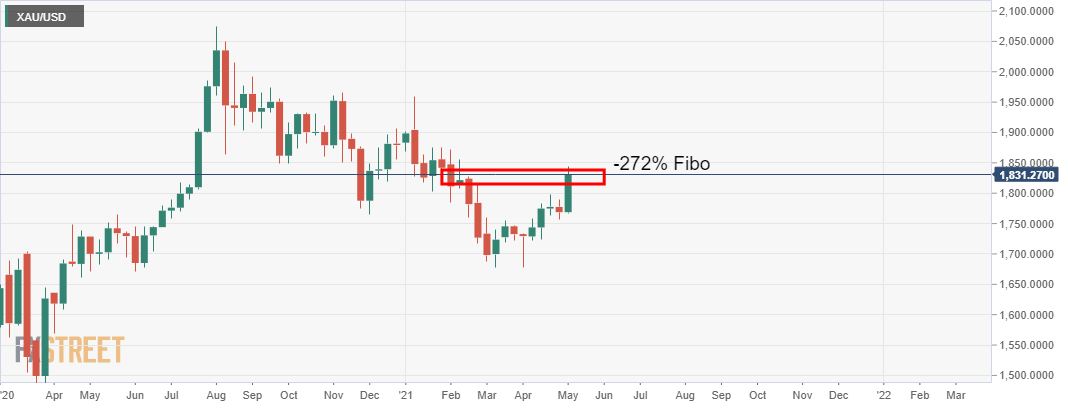
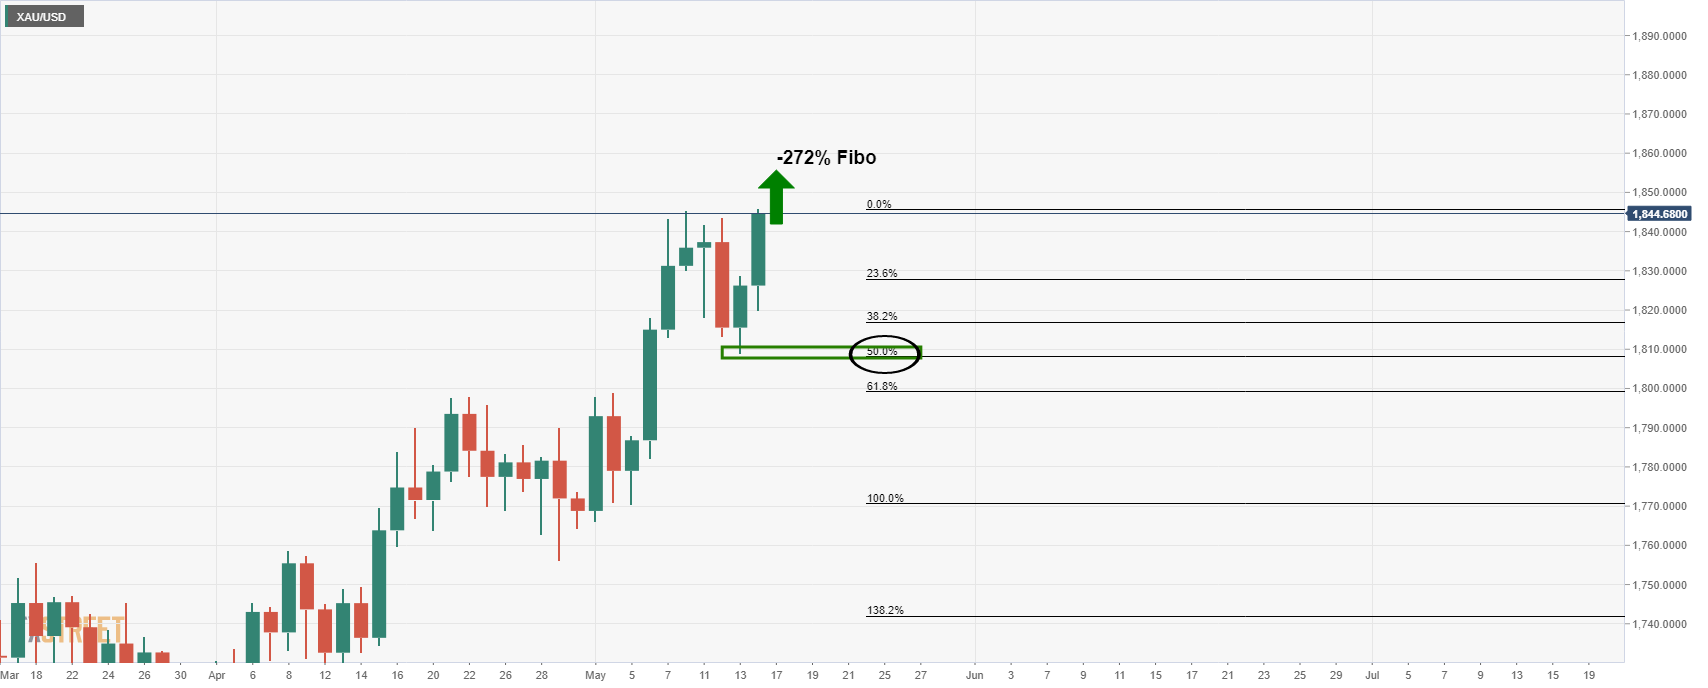
'The weekly chart shows that the impulse has made a -272% Fibonacci retracement of the prior bullish impulse as it takes on resistance.'
'Meanwhile, there is scope for a deeper retracement on the daily chart to test the 38.2% Fibo of the prior daily impulse...'
Live market analysis
The following is a top-down analysis of the live market that illustrates the prospect of a daily bullish continuation for the forthcoming days.
Monthly chart
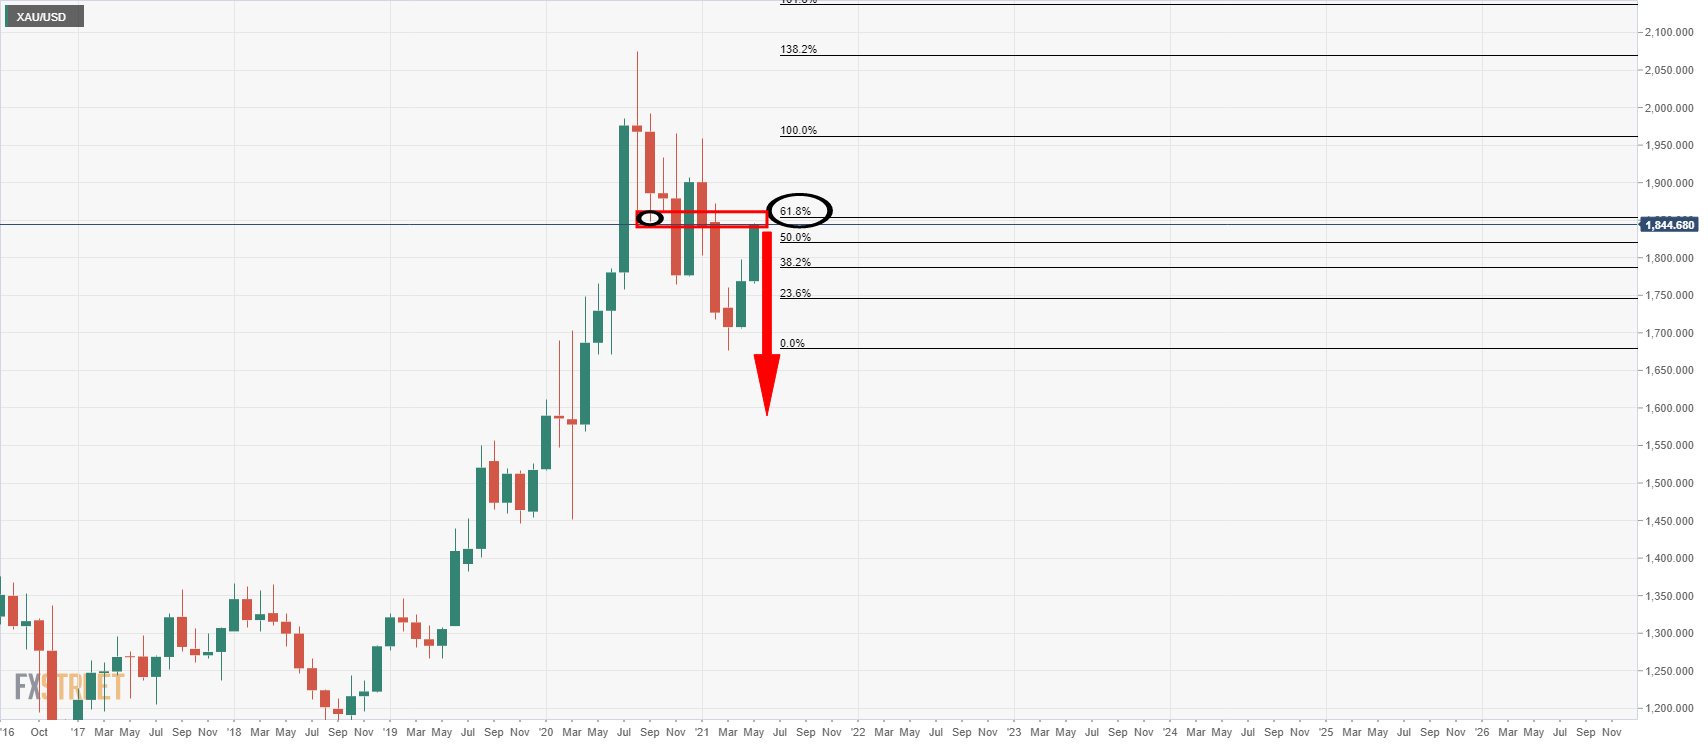
While there are probabilities of a downside continuation on the monthly chart, there is room to go on the upside before a fuller test of the 61.8% Fibonacci level.
Weekly chart
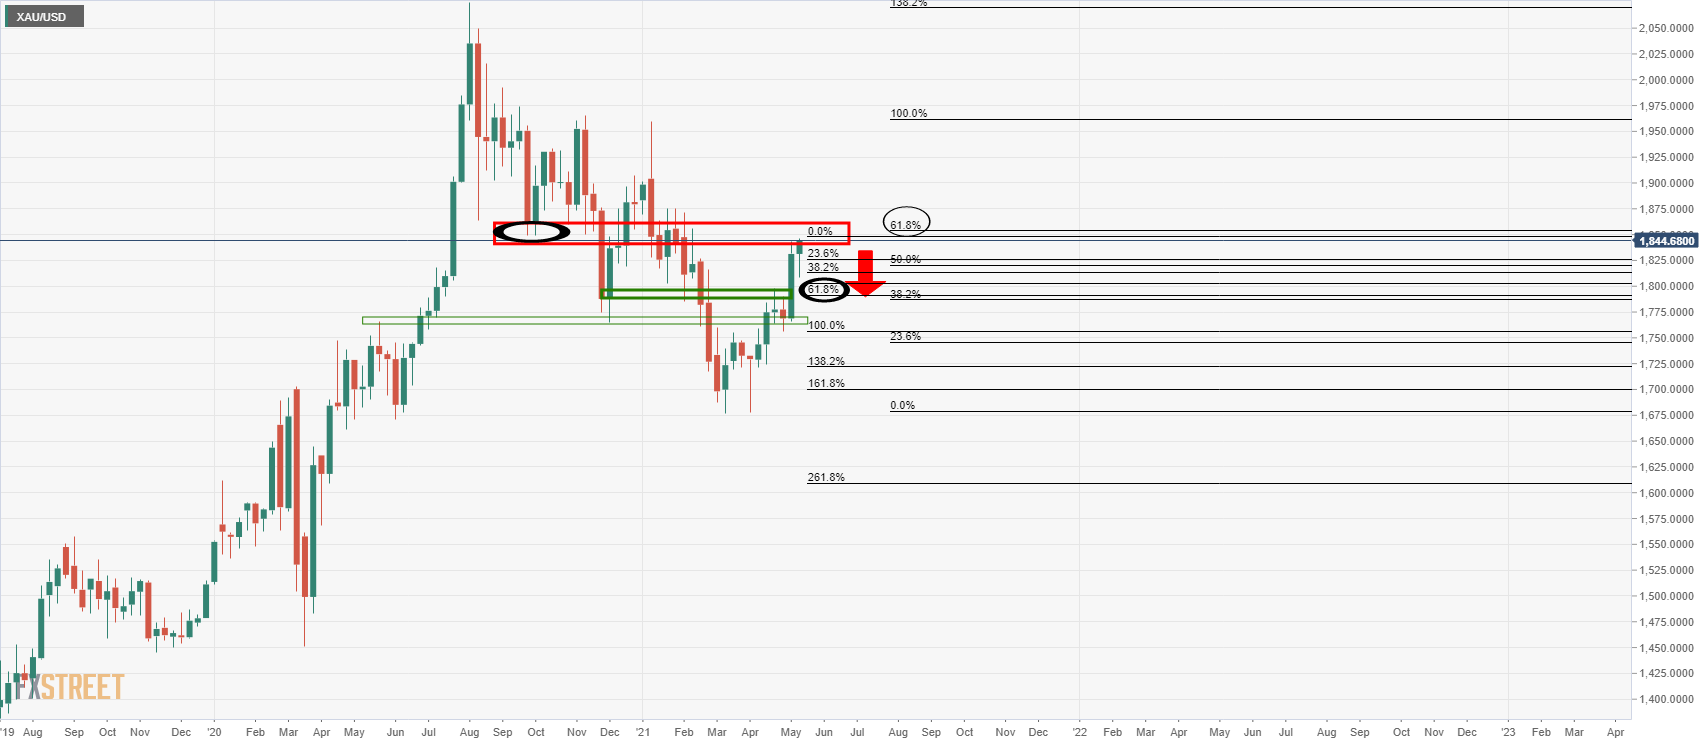
The price is strongly bullish on the weekly chart, but again there are prospects of a downside correction, albeit with room to the upside to test deeper into resistance.
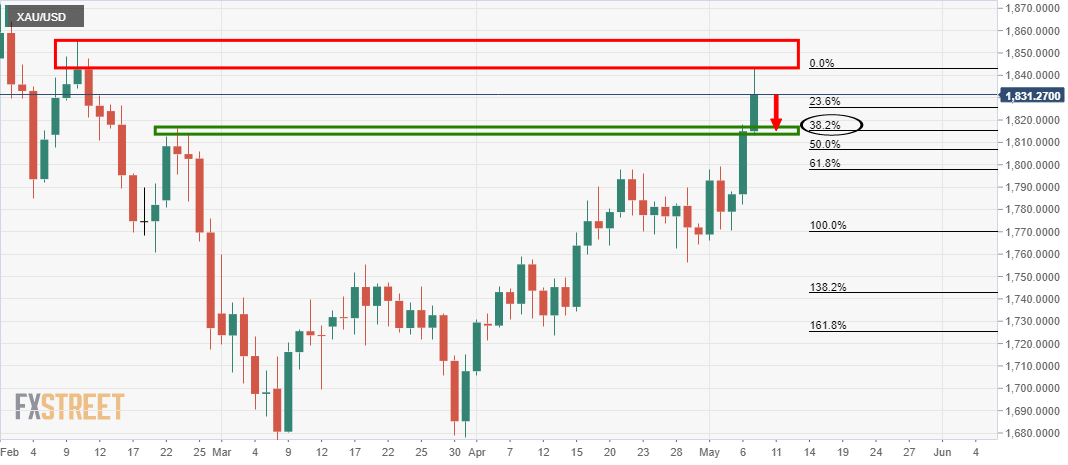
Daily chart
From a daily perspective, the bulls are taking on the prior highs and closed Friday's session strongly bid.
A run into the psychological $1,850 is on the cards with a -272% Fibo retracement of the prior correction coming in at $1,855.
Author

Ross J Burland
FXStreet
Ross J Burland, born in England, UK, is a sportsman at heart. He played Rugby and Judo for his county, Kent and the South East of England Rugby team.


