Chart of The Week: Gold meets long-term resistance structure around $1,700
- Gold bulls have been back in control to test 1700 handle.
- While below the 1700 handle, profit-taking could trigger a flush out of speculative bids.
- Correction territory opens a retracement to 1620s below 1640s.

Gold prices are on the rise, making a huge comeback since Mid-March lows. In futures, for example, gold settled at $1,477.90 an ounce on March 18, their lowest finish year to date, before eventually moving up to an intraday high of $1,754.50 on Thursday—the highest intraday mark since November 2012.
We have seen a shakeout of weak hands by the looks of things and year to date gold is now up more than 15%, versus a more than 14% decline in the S&P 500 index. Gold is now the strongest and at all-time highs against all currencies except for the US dollar at this point.
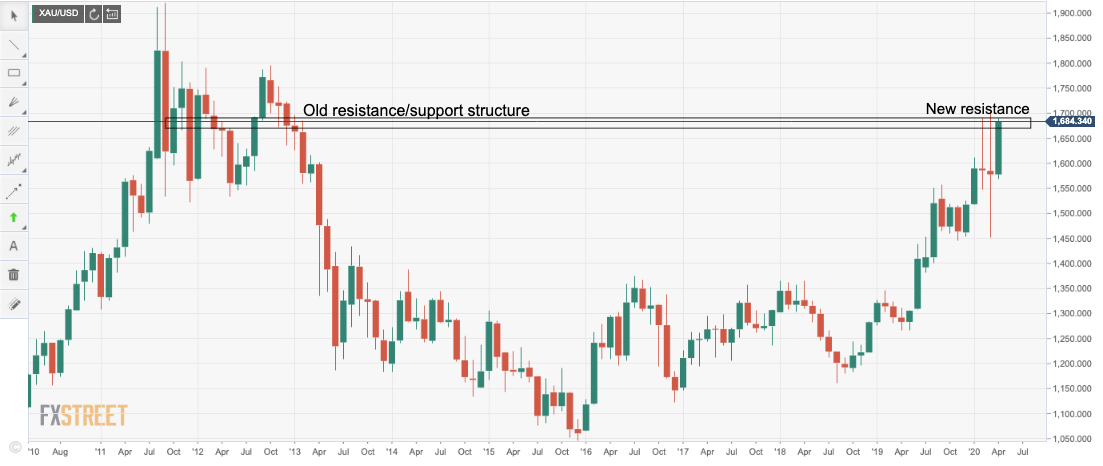
After settling at $1,752.80 on Thursday, prices now trade at about $171 an ounce away from the all-time intraday high of $1,923.70 on Sept. 6, 2011. Given the current spot resistance around $1,703, the following is a look at the various structures from the monthly chart time-frame and downside correction opportunities.
Monthly resistance
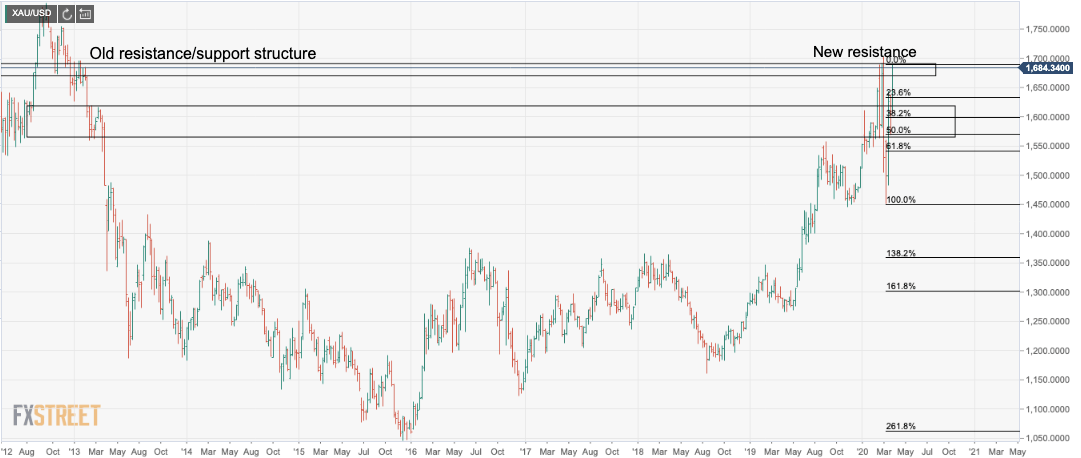
Monthly resistance and Fibonacci retracement targets
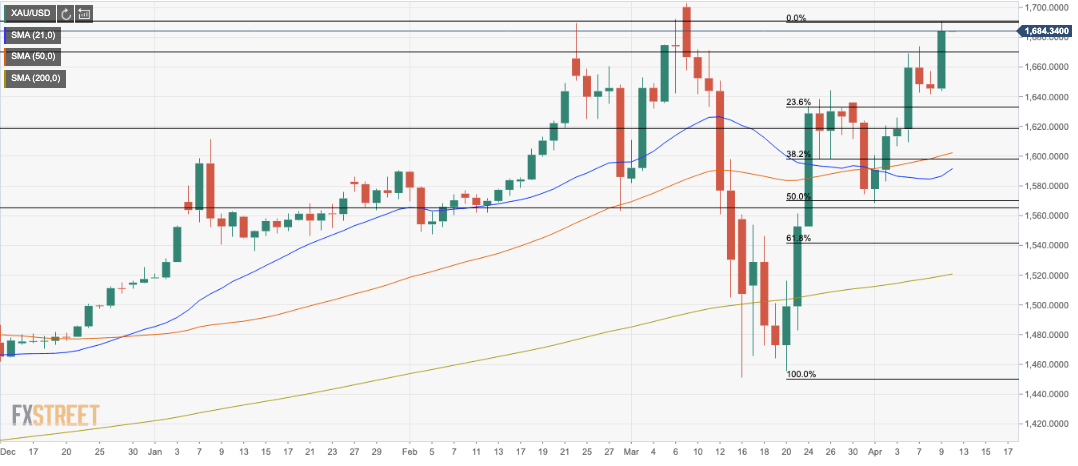
Daily Fibonacci retracement targets with 50 and 20-day moving average cluster/confluence
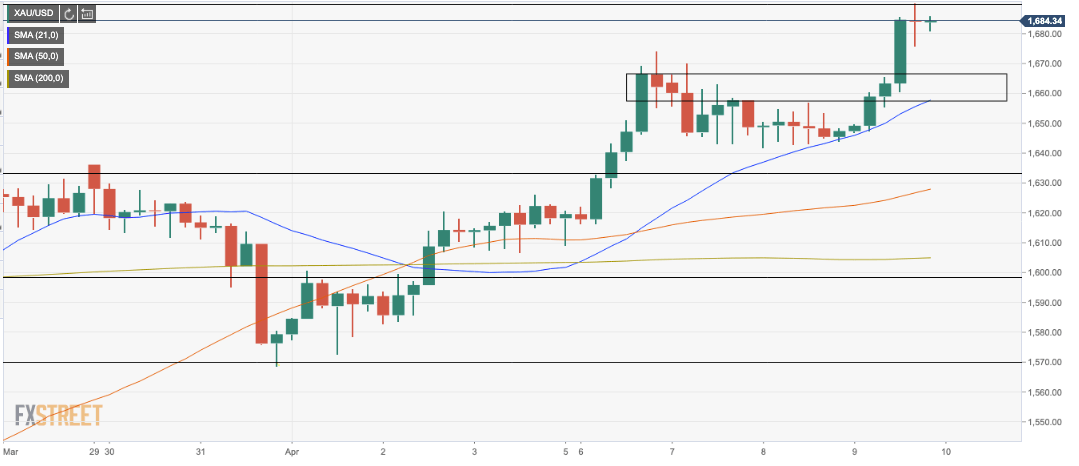
4-HR support structure
Bearish conclusion
While below the monthly resistance, as can be seen, there is room for a test of the 1620 level that guars the 38.2% and 20/50 daily moving averages, although a 4-HR support structure of between 1671 and the 20 4-HR MA at 1665 and then 1640 would need to give first.
Author

Ross J Burland
FXStreet
Ross J Burland, born in England, UK, is a sportsman at heart. He played Rugby and Judo for his county, Kent and the South East of England Rugby team.


