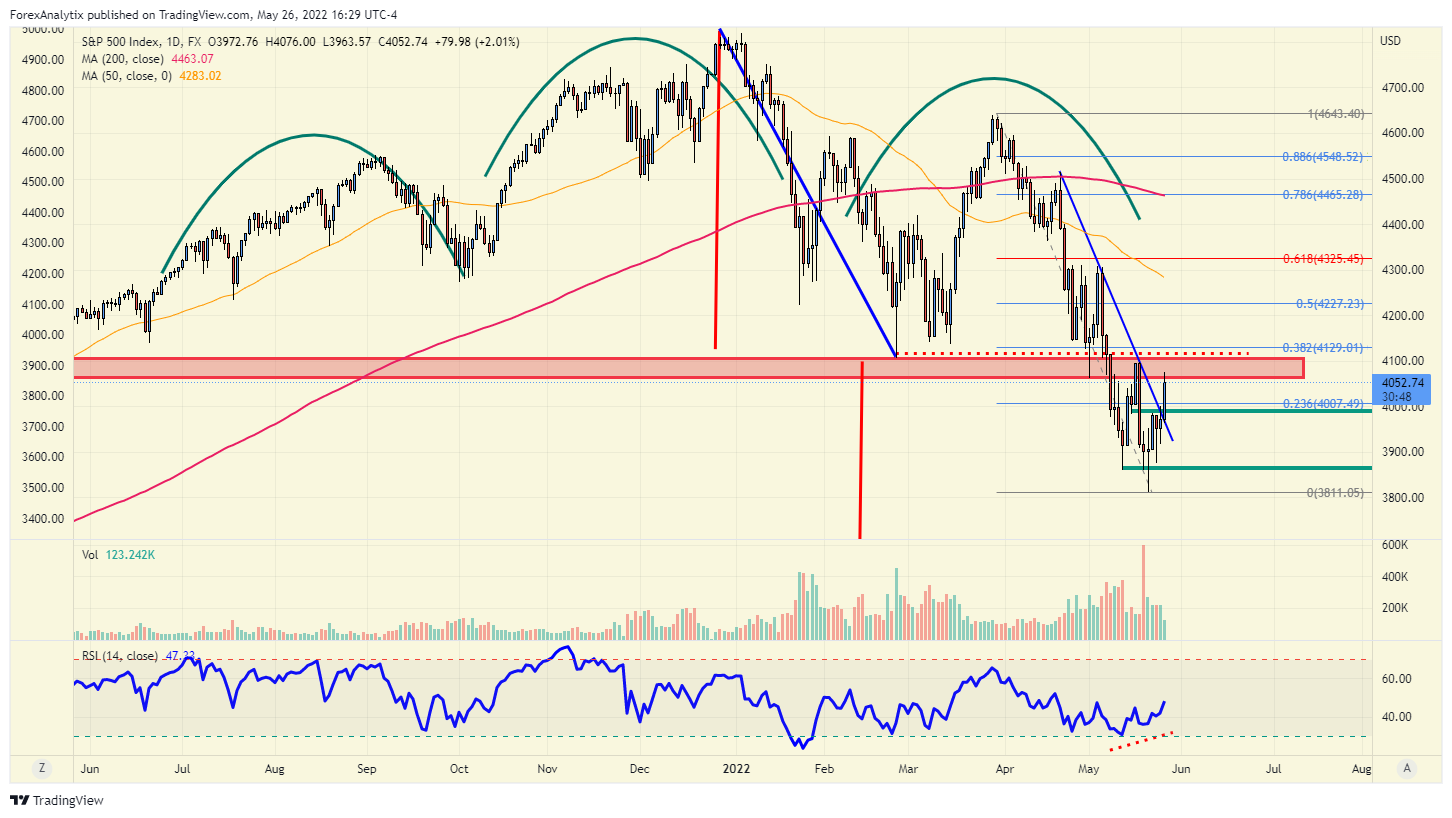
Chart of the day: S&P 500

The risk for the stock market that we outlined would be a continued rally higher near term. Sentiment was too bearish, and we have heard from some FOMC members recently which leads us to believe that their rhetoric may be changing near term to a less hawkish stance as US Data continues to come in weaker than expectations.
This has led to a rally from below the 3900 level and could also lead to a test of the 4100. With the "end of month" flows squarely in the sights of the market, stocks could gain some steam higher if the 4100 (neckline of the head and shoulder pattern and previous support) is broken. Since the volume has been light in this rally (see below) the risk is a rally attempt from here will probably fail. The question is "4100? 4200? Higher?" The 4129 level is the 38% Fibonacci retracement, and somewhere near the 50dma or between the 50% and 61.8% retracement seems like a likely upside target before selling resumes.
Author

Blake Morrow
Forex Analytix
Blake Morrow spent most of his professional career as the Chief Currency Strategist for Wizetrade group for 15 years, and then the Senior Currency Strategist for Ally Financial after the acquisition of Tradeking which owned the Wizetrade Group.


