Chart Analysis AUD/USD - 2026-02-25 17:01
- AUD/USD climbs to two-week highs, reclaiming the 0.7100 hurdle.
- The US Dollar faces some renewed downside pressure amid trade concerns.
- Australian inflation continued to run hot in January, bolstering the RBA’s decision.

AUD/USD seems to have finally left behind the recent inconclusive price action, setting sail to the area of YTD peaks north of 0.7100 the figure. The Aussie’s bullish view remains underpinned by elevated inflation in Oz coupled with the hawkish stance from the Reserve Bank of Australia (RBA).
The Australian Dollar (AUD) builds on Tuesday’s advance and lifts AUD/USD back above the key 0.7100 hurdle on Wednesday.
Indeed, the weaker tone in the Greenback collaborates with the upside traction in spot, while another hot reading from the inflation in Australia props up the recent decision by the RBA to tighten its monetary policy and maintain a cautious stance going forward.
Australia: slowing, not stumbling
Australia’s economy is easing off the boil, but this still looks like a controlled deceleration rather than the start of something uglier. Growth is cooling, yes, but the engine is still running.
The February preliminary Purchasing Managers' Index (PMI) surveys back that up. Manufacturing printed 52.0 and Services 52.2, comfortably in expansion territory. Not booming, but clearly not contracting either.
Retail spending remains resilient; the trade surplus widened to A$3.373 billion at the end of 2025, and Gross Domestic Product (GDP) expanded 0.4% QoQ in Q3, lifting annual growth to 2.1%. That is broadly in line with what the RBA had anticipated.
The labour market tells a similar story: Employment Change rose by 17.8K in January, a touch below expectations, while the Unemployment Rate held steady at 4.1%. This is gradual cooling, not labour market stress.
Inflation remains the pressure point
If there is a fault line, it is inflation.
January inflation data once again reminded markets that price pressures are not fading quickly. Indeed, the headline Consumer Price Index (CPI) held at 3.8% YoY for a second straight month, slightly above the 3.7% consensus. More importantly, the Trimmed Mean, the RBA’s preferred core gauge, edged up to 3.4% YoY from 3.3%.
Disinflation is intact, but it is not accelerating.
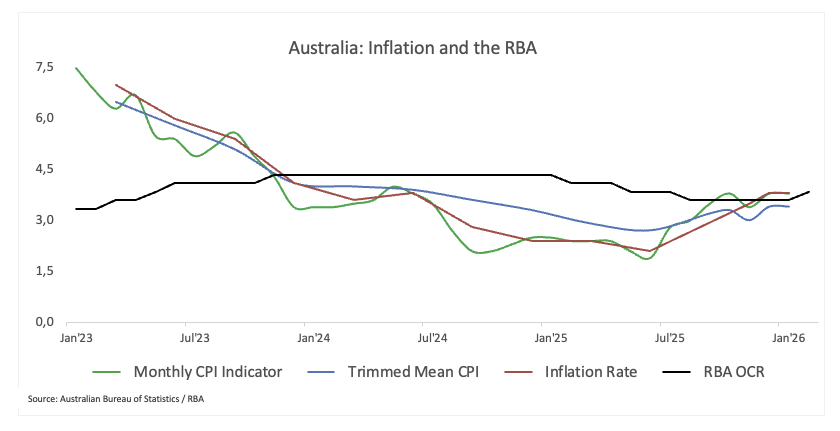
Looking ahead, the RBA still sees inflation peaking in Q2 2026, with trimmed mean CPI projected around 3.7% and headline CPI near 4.2%, before gradually easing back towards the midpoint of the 2–3% target range by mid-2028.
In short, policy is restrictive for a reason: The inflation fight is not finished.
Credit data reinforce that message after Home Loans rose 10.6% QoQ in Q4, while Investment Lending increased 7.9%, showing that financial conditions are tight enough to cool demand but not tight enough to choke it off.
China: steady support, not a catalyst
China remains a stabiliser for the Australian Dollar, though not a source of strong momentum.
The economy expanded 4.5% YoY in Q4 and 1.2% QoQ, while Retail Sales rose 0.9% YoY in December. Respectable numbers, but hardly transformative.
The January PMI split is telling: the official Manufacturing and Non-Manufacturing slipped into contraction at 49.3 and 49.4 respectively, while the Caixin Manufacturing PMI and Caixin Services PMI held in expansion at 50.3 and 52.3, respectively. Larger state-linked sectors appear softer, smaller private firms somewhat more resilient.
The trade surplus widened to $114.1 billion in December, yet inflation remains subdued. CPI rose just 0.2% YoY and Producer Price Index (PPI) fell 1.4% YoY. That is lingering disinflation, not reflation.
On the policy side, the People’s Bank of China (PBoC) left the one-year and five-year Loan Prime Rate (LPR) unchanged at 3.00% and 3.50%. The tone is measured and supportive rather than aggressive. Stability over stimulus.
For the Aussie, that means China is no longer a drag, but nor is it a powerful tailwind.
RBA: restrictive, but measured
Earlier this month, the RBA lifted the Official Cash Rate (OCR) to 3.85%, reinforcing that inflation remains the central priority.
Updated projections suggest price pressures will stay above target for much of the forecast horizon. The Minutes were clear: without the latest hike, inflation would likely have remained above target for too long. Policymakers judged that risks had shifted sufficiently to warrant further tightening.
But this is not autopilot. There is no pre-commitment. The path remains data dependent.
Markets are currently pricing just over 41 basis points of additional tightening by year-end. Not aggressive, but enough to maintain a meaningful yield floor under the AUD.
Positioning: rebuilding exposure
Commodity Futures Trading Commission (CFTC) data show non-commercial traders increased net long positions to nearly 46K contracts in the week to February 17, the strongest level since late 2017.
This does not look like froth. It looks like exposure is being rebuilt.
Furthermore, open interest climbed to around 256.2K contracts, suggesting improving conviction without obvious crowding. There remains room for extension if sentiment continues to firm.
Investors are stepping back into the Aussie, cautiously but deliberately.
What matters now
Near term: the US Dollar still sets the rhythm. Strong US data, renewed tariff rhetoric or geopolitical flare-ups can quickly reshape AUD/USD dynamics. Domestically, the Fed–RBA yield spread remains broadly supportive of the Aussie given the RBA’s firm, cautious stance.
Risks: the Australian Dollar remains a high-beta currency. If global risk appetite deteriorates, if China falters, or if the Greenback stages a sustained rebound, the unwind could be swift.
Technical corner
In the daily chart, AUD/USD trades at 0.7116. The near-term bias is bullish as price extends above the 55-day, 100-day and 200-day Simple Moving Averages (SMAs), which all trend higher and frame a rising medium-term structure. The pair is testing the 61.8% Fibonacci retracement at 0.6699 and the 50.0% retracement at 0.6784 measured from the 0.6421 low to the 0.7147 high, with spot now pressing into the upper half of that recovery range. The Relative Strength Index (RSI) around 65 stays in positive territory without reaching overbought extremes, while the Average Directional Index (ADX) above 40 indicates a strong underlying trend, reinforcing the upside bias as long as the pair holds above the clustered moving averages.
Immediate resistance is located at the horizontal level of 0.7158, ahead of 0.7283, with a break above this band opening the way toward the more distant cap at 0.7661. On the downside, initial support aligns at 0.7050/0.7040 near recent closes, followed by the prior reaction area around 0.7000 and then the 23.6% Fibonacci retracement at 0.6976. Below there, firmer support emerges at 0.6897, with deeper protection at 0.6660 and 0.6593, where previous horizontal floors converge near the rising SMAs. As long as the pair holds above 0.6897, dips would maintain a buy-on-weakness profile within the prevailing bullish trend.
(The technical analysis of this story was written with the help of an AI tool.)
Bottom line: constructive, not complacent
Australia’s macro backdrop remains resilient. The RBA is restrictive. Positioning is improving. China is stable enough.
That keeps the broader bias tilted to the upside.
But this is not a defensive currency. The Aussie thrives when global sentiment is constructive and struggles when risk sours. For now, dips are likely to attract buyers as long as the US Dollar remains contained.
If that changes, so does the narrative.
Inflation FAQs
Inflation measures the rise in the price of a representative basket of goods and services. Headline inflation is usually expressed as a percentage change on a month-on-month (MoM) and year-on-year (YoY) basis. Core inflation excludes more volatile elements such as food and fuel which can fluctuate because of geopolitical and seasonal factors. Core inflation is the figure economists focus on and is the level targeted by central banks, which are mandated to keep inflation at a manageable level, usually around 2%.
The Consumer Price Index (CPI) measures the change in prices of a basket of goods and services over a period of time. It is usually expressed as a percentage change on a month-on-month (MoM) and year-on-year (YoY) basis. Core CPI is the figure targeted by central banks as it excludes volatile food and fuel inputs. When Core CPI rises above 2% it usually results in higher interest rates and vice versa when it falls below 2%. Since higher interest rates are positive for a currency, higher inflation usually results in a stronger currency. The opposite is true when inflation falls.
Although it may seem counter-intuitive, high inflation in a country pushes up the value of its currency and vice versa for lower inflation. This is because the central bank will normally raise interest rates to combat the higher inflation, which attract more global capital inflows from investors looking for a lucrative place to park their money.
Formerly, Gold was the asset investors turned to in times of high inflation because it preserved its value, and whilst investors will often still buy Gold for its safe-haven properties in times of extreme market turmoil, this is not the case most of the time. This is because when inflation is high, central banks will put up interest rates to combat it. Higher interest rates are negative for Gold because they increase the opportunity-cost of holding Gold vis-a-vis an interest-bearing asset or placing the money in a cash deposit account. On the flipside, lower inflation tends to be positive for Gold as it brings interest rates down, making the bright metal a more viable investment alternative.
Author

Pablo Piovano
FXStreet
Born and bred in Argentina, Pablo has been carrying on with his passion for FX markets and trading since his first college years.


