Change in trend window: Does this mean we have a good trading opportunity?

Special announcement – There will be a Fed FOMC policy announcement on Wednesday, at about 2 PM EST.
1/25 Recap - The S&P opened with an 44 handle gap down and then traded another 80 handles lower into a 10:06 AM low of the day. From that low, the S&P rallied 66 handles into a 10:48 AM high. From that high, the S&P declined 46 handles into am 11:39 AM low. From that low, the S&P zig zagged 33 handles higher into a 12:25 PM high. From that high, the S&P declined 26 handles into a 12:56 PM low. From that low, the S&P rallied 96 handles into a 2:57 PM high of the day. From that high, the S&P declined 62 handles into a 3:53 PM low. From that low, the S&P bounced 7 – 11 handles into the close.
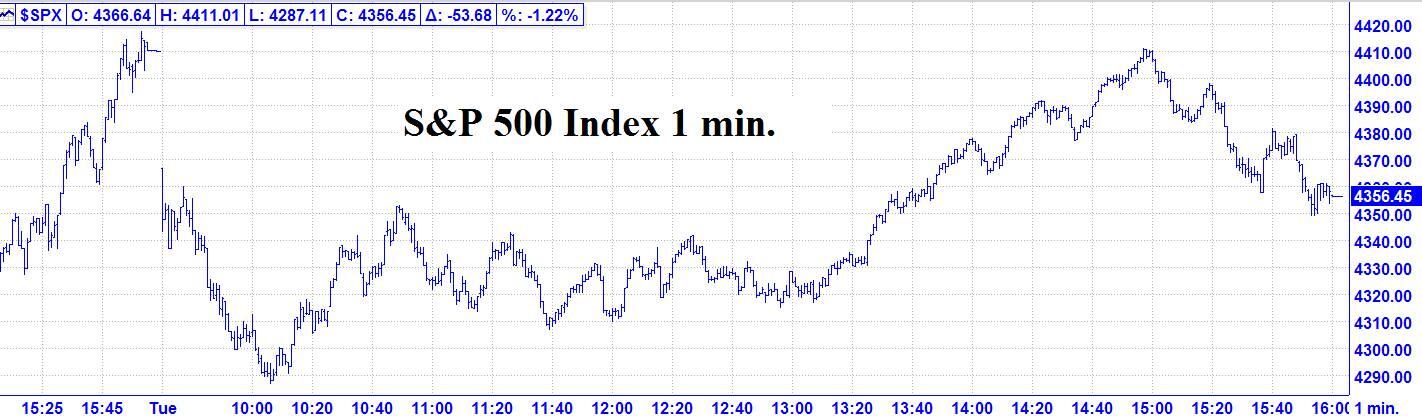
1/25 – The major indices, following a huge morning decline, recouped most of the decline by late afternoon and then had a sizeable decline in the last half hour to finish the day per the following closes: INDU - 66.67; S&P 500 - 53.68; and the NASDAQ Composite - 315.68.
Looking ahead - We are now at the next change in trend window. However, this doesn’t necessarily mean we have a good trading opportunity. We want to see the market at some extreme relative to recent price action and the S&P is now positioned about midway to the 1/24 range. Another huge opening to test the recent high or low could improve the situation. Keep in mind it’s Fed day.
The NOW Index has moved back to the NEUTRAL Zone.
Coming events
(Stocks potentially respond to all events).
C. 01/25 AC – Jupiter 120 US Jupiter. Important change in trend US Stocks, T-Bonds, US Dollar.
D. 01/25 AC – Saturn 120 US Saturn. Important change in trend US Stocks, T-Bonds, US Dollar.
E. 01/28 AC – Venus in Capricorn goes Direct. Major change in trend Cattle, Coffee, Copper, Cotton, Sugar, & Wheat.
F. 01/28 AC – Jupiter 90 US Ascendant. Important change in trend US Stocks, T-Bonds, US Dollar.
Stock market key dates
Market math
DJIA* – 1/25-26, 1/28 AC.
S&P 500* - 1/28 AC.
Fibonacci – 1/25.
Astro – 1/25-26, 1/28 AC.
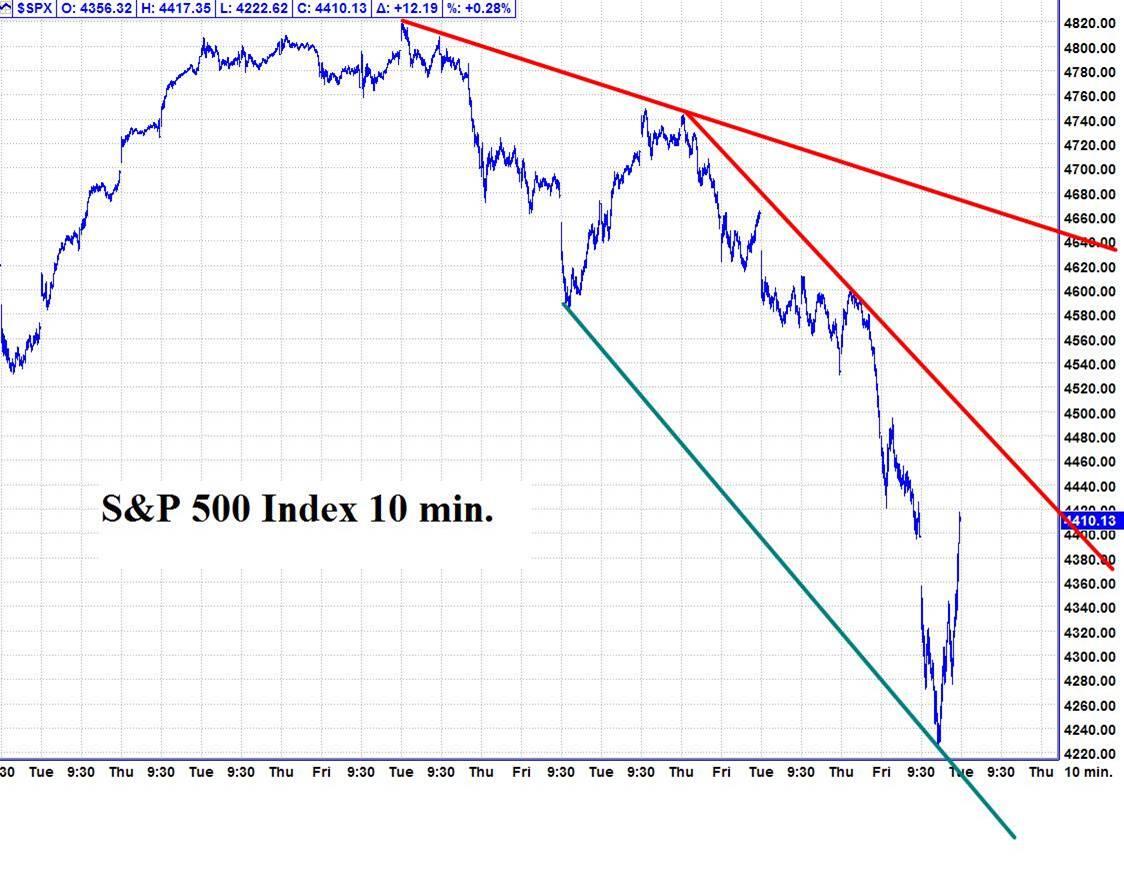
Please see below the S&P 500 10 minute chart.
Support - 4340, 4230 Resistance – 4440.
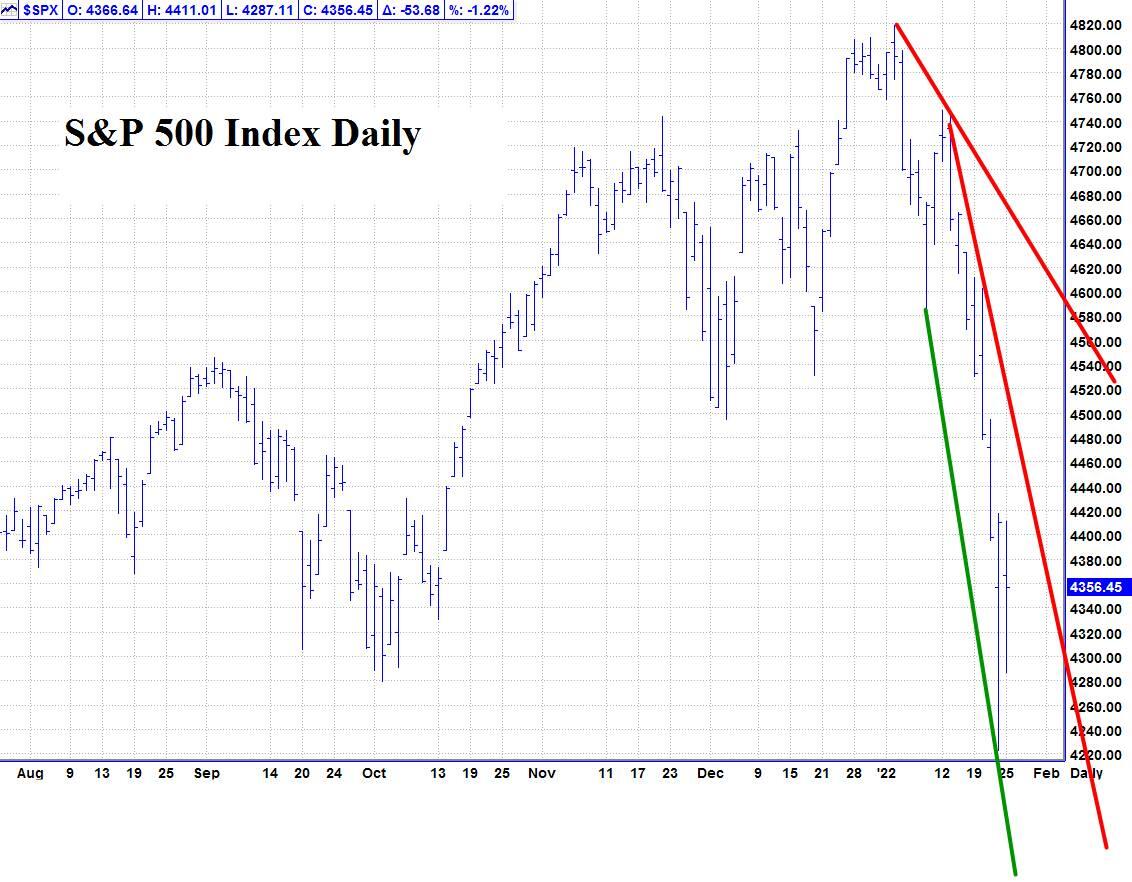
Please see below the S&P 500 Daily chart.
Support - 4340, 4230 Resistance – 4440.
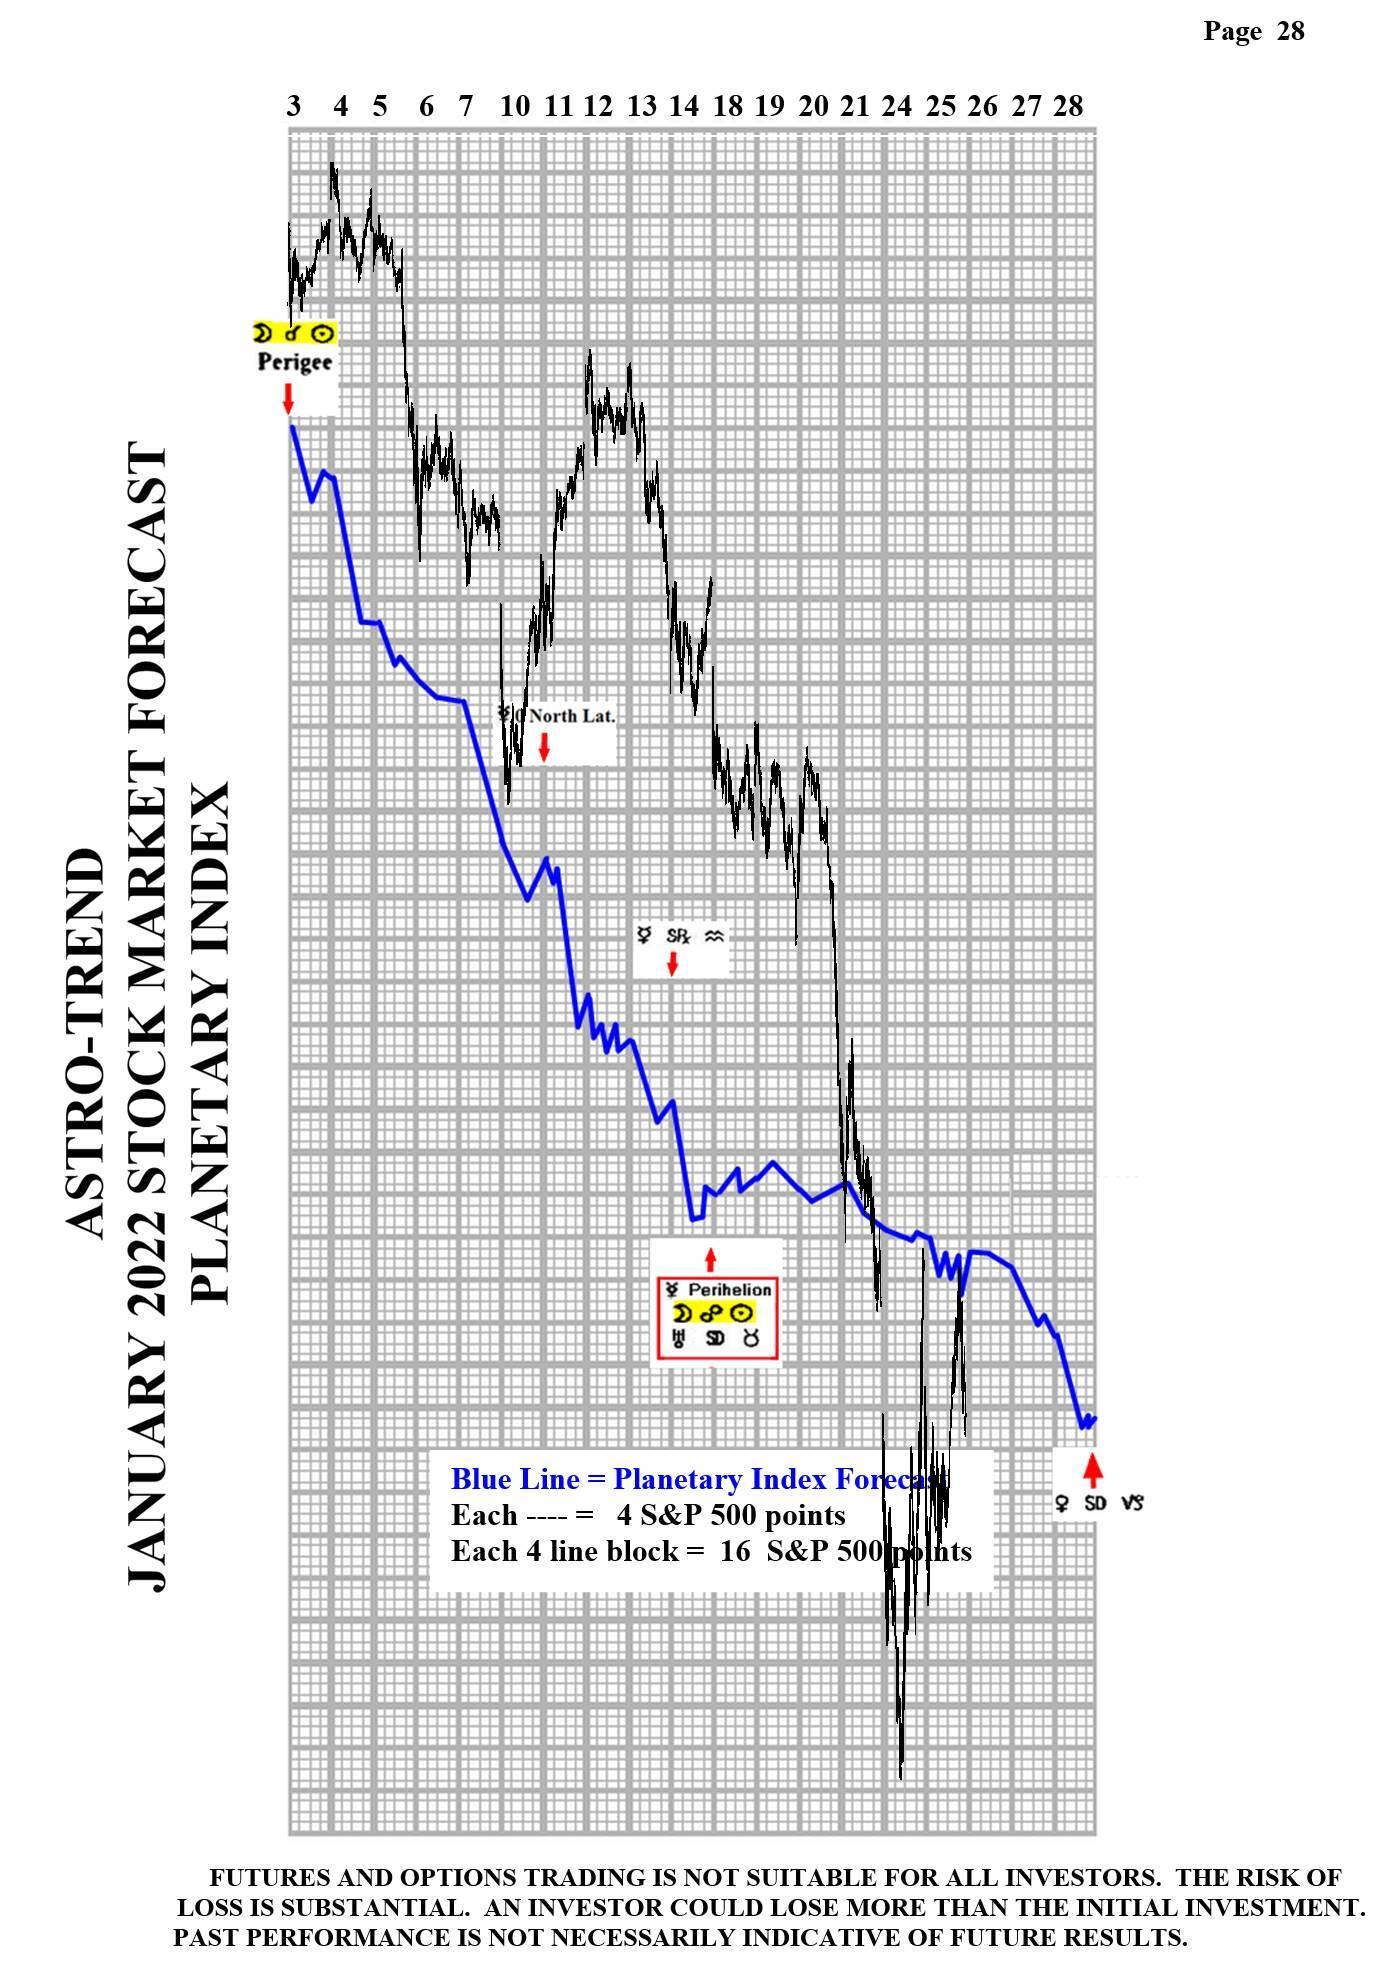
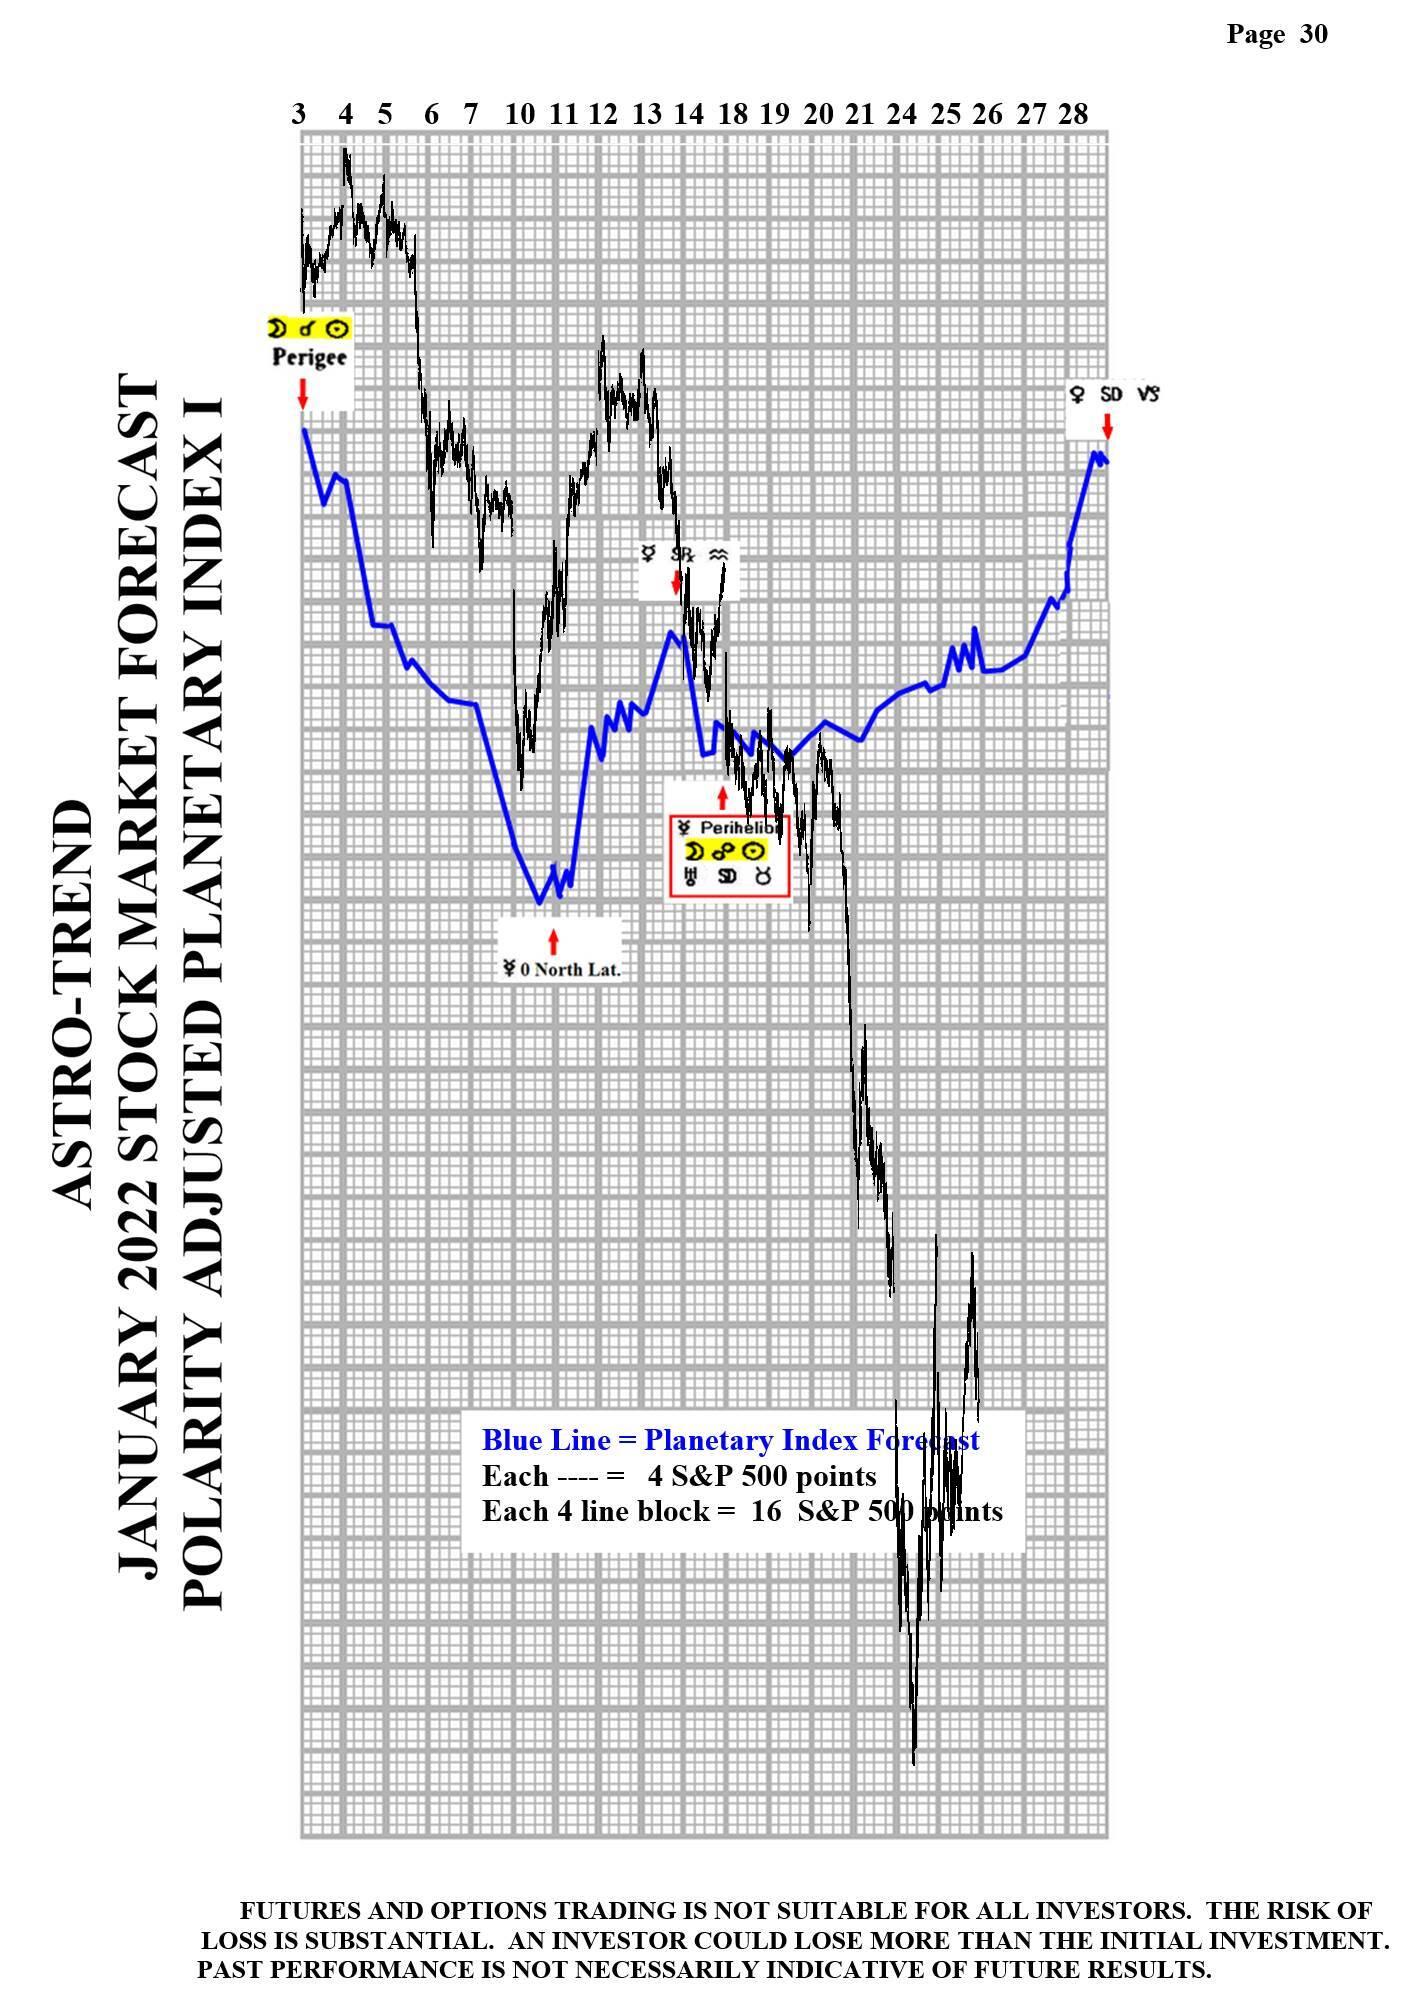
Please see below the January Planetary Index charts with S&P 500 10 minute bars for results. As of January 21, I am dropping Planetary Index charts marked Pages 29 and 31.
Author

Norm Winski
Independent Analyst
www.astro-trend.com


