Ceasefire or not – Gold is still declining

If so, what could make it actually rally?...
In yesterday’s article entitled Trump’s Art of the USD, I wrote that the Peak Chaos was likely reached and now the markets are likely to react to even moderate levels of chaos as if the latter was gone, or low. On top of that, it seems that Trump’s previous plan to create uncertainty giving him leverage in negotiations is now turning into the stage where some results would be necessary. Please note that it’s not just my own interpretation – it’s what Trump wrote himself in his Art of the Deal book, which is now the blueprint for his actions.
From chaos to control
That’s probably why he’s insisting on the narrative that Iran’s nuclear facilities were completely destroyed despite the report from Pentagon says otherwise.
The latter confirms that we’re likely headed into a period of greater stability, however unlikely it may seem given all that happened in the previous weeks.
Gold and mining stocks seem to be already sensing that as they are already declining. In fact, gold did something that it wasn’t able to do months – it confirmed the breakdown below its rising support line.
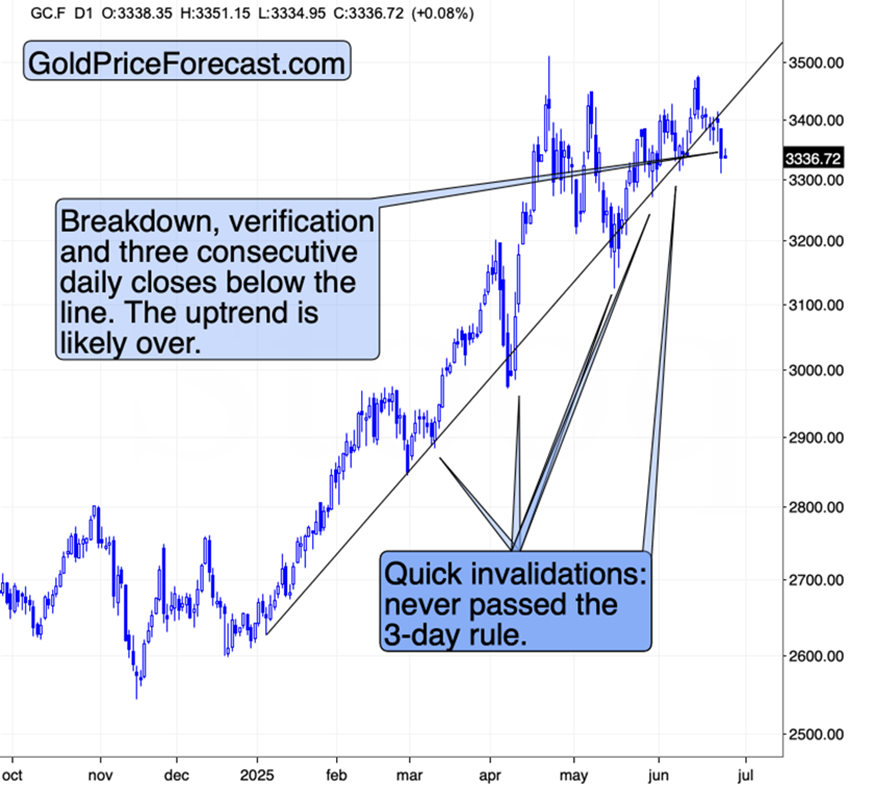
The support line is based on the local bottoms that we saw in January and February. Gold price tried to break below this price four times: in March, in April, twice in May, and once in early June. In each of those cases, the breakdown was quickly invalidated. By quickly, I mean that gold never managed to stay below this line for three days.
Until yesterday.
Yesterday marked the third consecutive daily close below this rising support line, and since gold is not rallying today (and neither is silver), it seems that we’ll get a fourth daily close below it soon. Gold is still holding above $3,300 per ounce, but it might not be for long.
On top of that, we see that this time, gold first moved back to this trend line and failed to rally above it. This was a tiny verification, and now we have the final confirmation coming from the daily closes.
Same with gold miners.
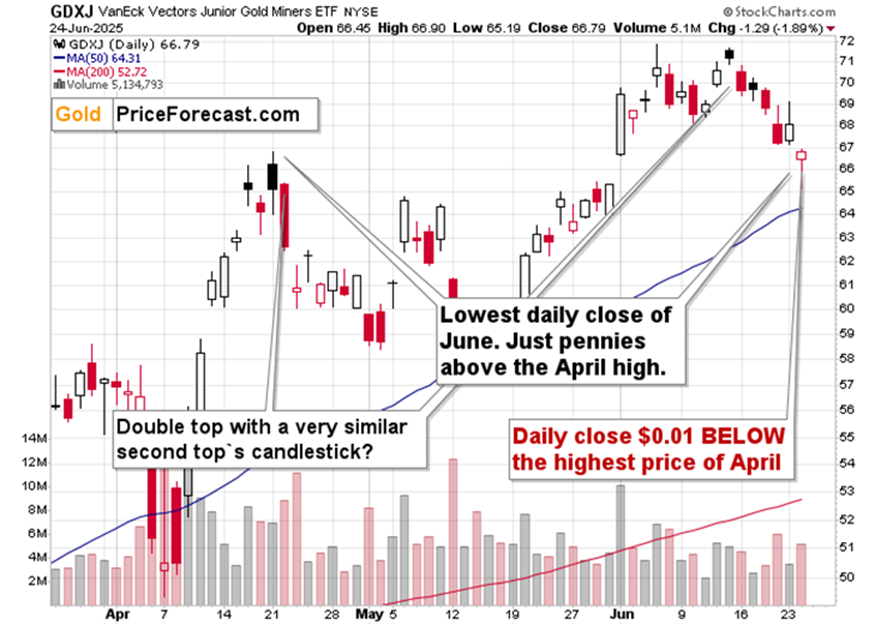
Yes, the GDXJ did reverse before the end of the day, but it was still the lowest daily close recorded in June.
Plus, this ETF closed $0.01 (but still) below its highest April price. We still have several days left before the end of the month, and given that gold is now declining almost regardless of what’s going on in the world, it seems quite likely that we’ll see GDXJ in the red in June.
For example, gold ignored USD’s move to its recent lows.
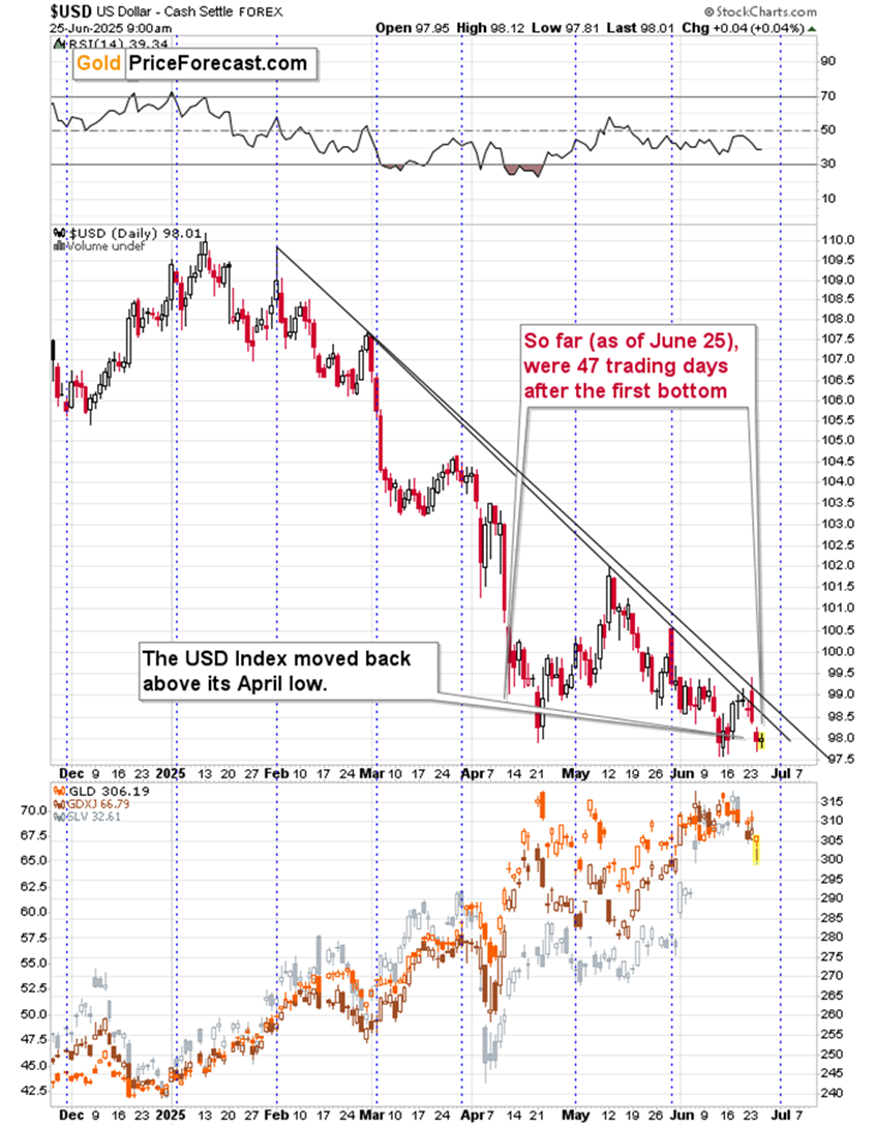
When the USD Index declined to about 98 in April, gold soared.
When the USD Index declined to about 98 in early June, gold moved up, but not significantly so.
And now, with the USD Index testing 98 once again, gold is declining.
Plus, the USD Index’s turning point is about to be reached – the USDX has a tendency to reverse its course close to the turn of the month. Earlier this year, these were local tops, but in the previous years, we saw many bottoms on those occasions. As the most recent move was to the downside, this might mark the final bottom.
Again, gold is declining despite the military conflict between Israel and Iran (and even regardless of the involvement of the U.S. bombers) as well as the move lower in the USD Index.
This is a clear sign that gold is ready to fall further – probably significantly so.
- But PR, the USD Index has been trading this low for almost 50 days now – isn’t this too long for a bottom? Won’t it slide from here after all?
No.
I mean, anything could happen on the markets, but this is very unlikely in my view.
USD isn’t the weakest link
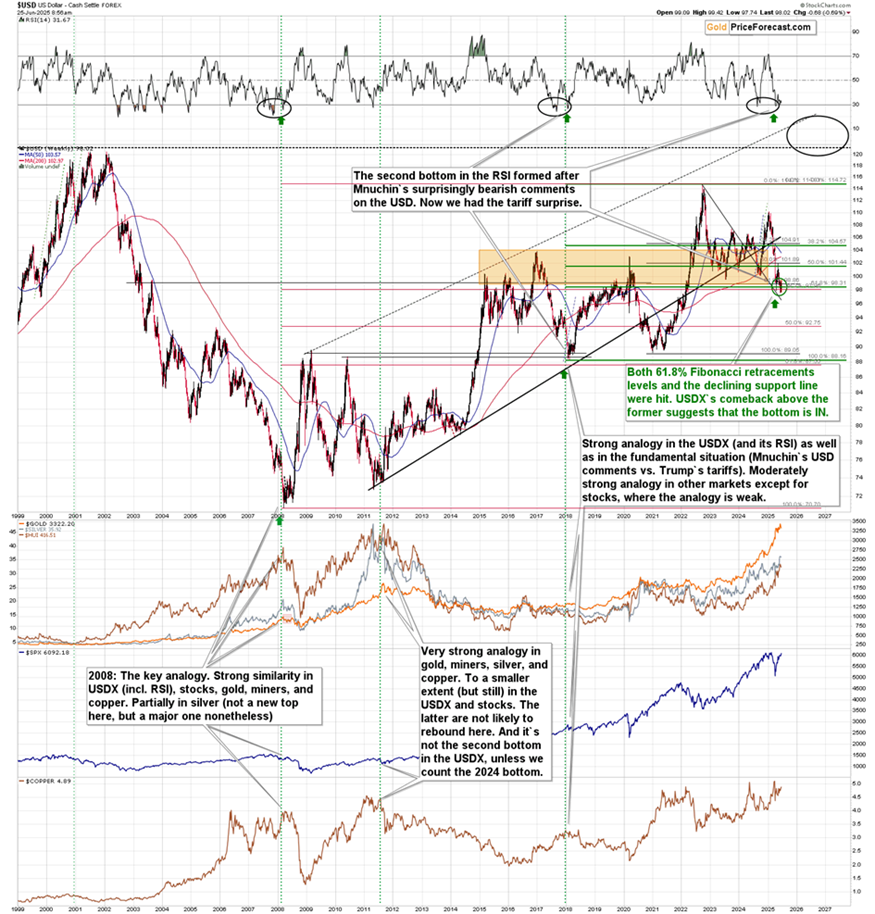
The USD Index is sitting on combination of very powerful support levels – the 38.2% Fibonacci retracement based on the 2008 – 2022 rally as well as the 61.8% Fib. retracements based on the 2018 – 2022 and 2020 – 2022 rallies.
Yes, issues like twin deficits remain unresolved, but let’s keep in mind that the USD Index is a weighted average of currency exchange rates – and fundamental situations in the Eurozone and Japan are not really better than they are in the U.S. – and the same goes for other countries, but EUR and JPY have the highest weight in the USD Index.
Besides, broad bottoms in the USD Index are quite common – and the final bottoms quite often form close to the middle of the year, which is exactly where we are right now.
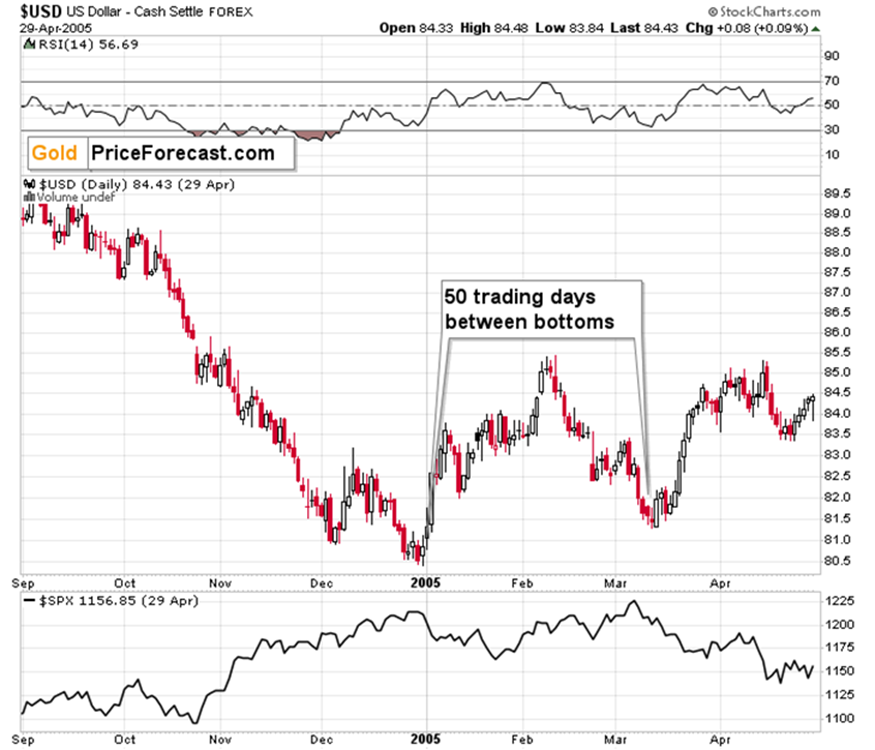
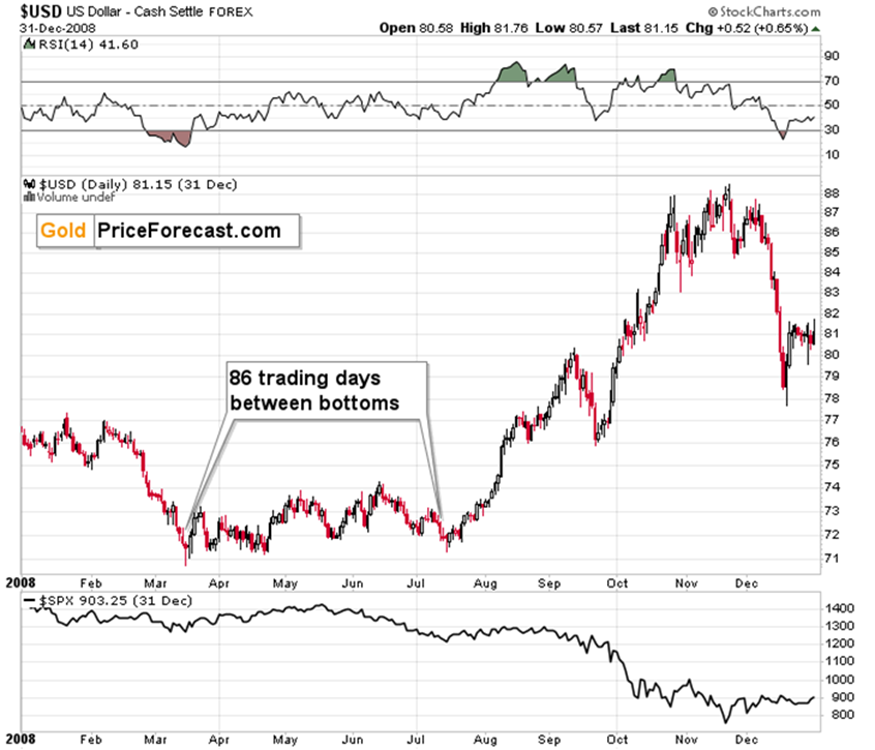
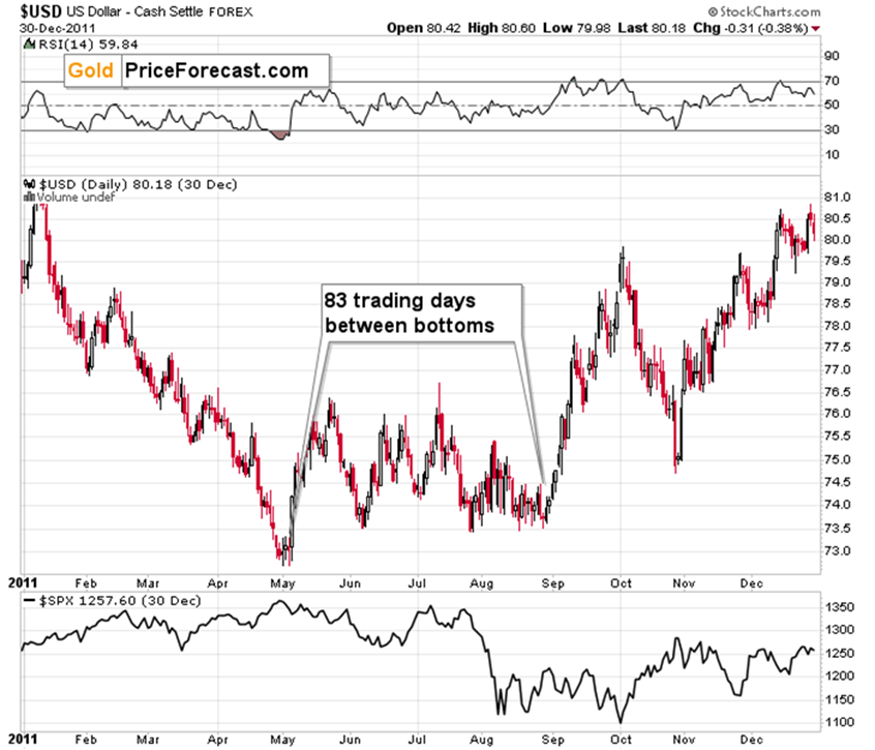
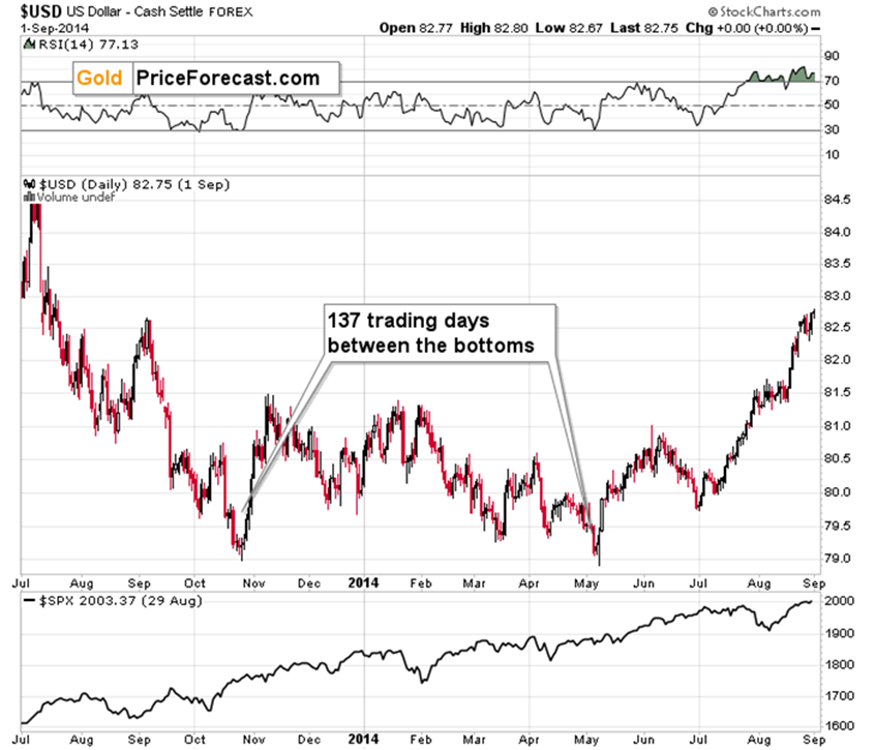
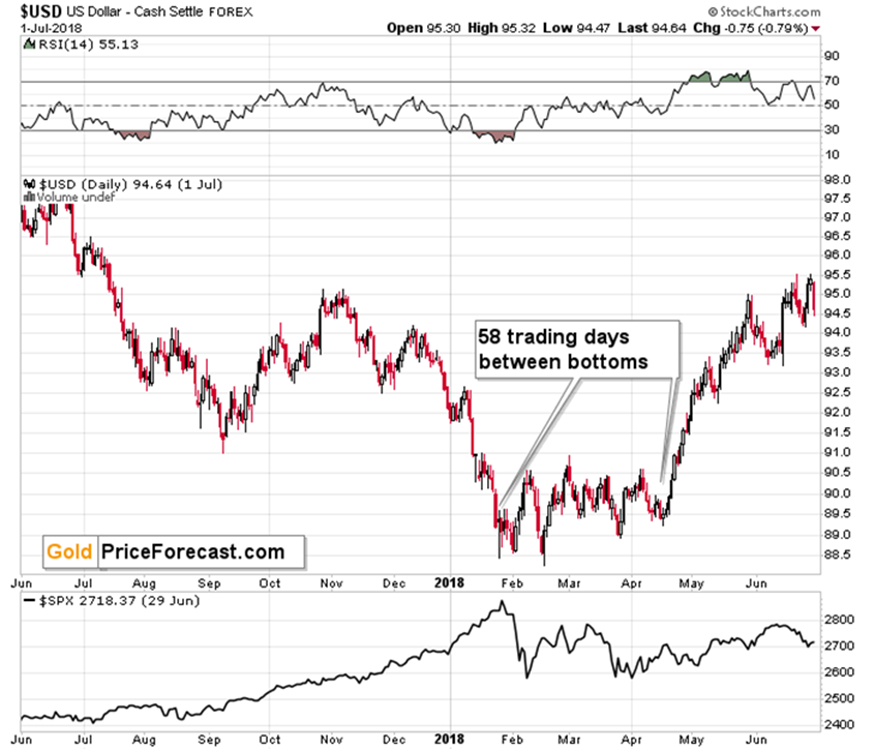
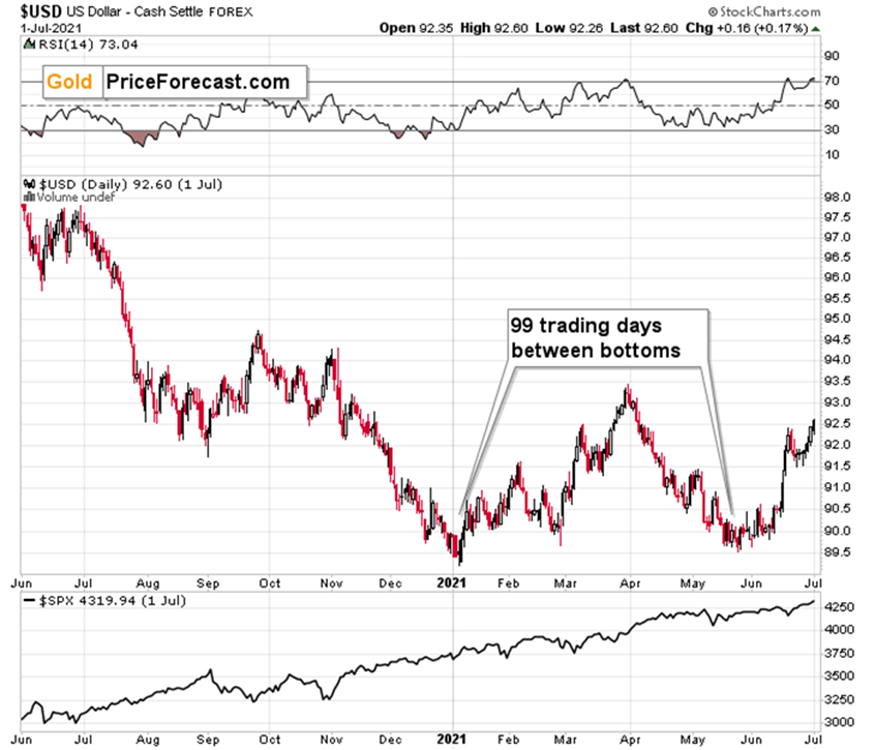
As you can see, in recent years, there were two cases when the broad bottom formed between 50 and 60 trading days. In other cases, those bottoms took longer.
Consequently, with this bottom being formed over 47 trading days (as of today) is completely normal. In fact, if the USD Index rallies from here, it will be the shortest bottoming period in a long time.
This creates the opposite question – has enough time passed for the USD Index to form the final bottom? In my view, the answer is yes, as 47 is not far from 50, and Trump’s decision framework now calls for some successes and stability. This should be positive for the U.S. dollar (while being negative for gold).
Did gold rally based on the increased (real and perceived) chaos in the previous weeks and months? Of course.
But does it mean that it will rally more? Not necessarily. Gold has not only managed NOT to rally despite further increases in chaos (Middle East), but even declining in this environment. This, plus the fact that Trump’s Art of the USD now calls for results – and likely increased levels of stability – higher values of USD and lower values of gold are to be expected.
Want free follow-ups to the above article and details not available to 99%+ investors? Sign up to our free newsletter today!
Want free follow-ups to the above article and details not available to 99%+ investors? Sign up to our free newsletter today!
Author

Przemyslaw Radomski, CFA
Sunshine Profits
Przemyslaw Radomski, CFA (PR) is a precious metals investor and analyst who takes advantage of the emotionality on the markets, and invites you to do the same. His company, Sunshine Profits, publishes analytical software that any


