Bitcoin collapses to probe demand around key level

Bitcoin goes from how “how high can it go?” to “how low can it go?” in a matter of days. After surging to almost $20,000, the crypto currency has taken a spectacular dive ever since the CME started offering Bitcoin futures at the start of this week. From its high of $19,666 on Sunday, it dropped to a low so far of $12,560 earlier this morning. Yes, that’s a $7,000+ or 36% drop in just six 6 days. In theory, Bitcoin has officially entered a bear market having dropped more than 20% from its high. Anyone complaining about the lack of volatility in the financial markets has clearly not paid attention to Bitcoin.
The volatility is going to last for a while as price discovery continues. After its parabolic-like rally, a crash was imminent and so it has proved. But this doesn’t tell you anything about where Bitcoin will be heading to next. No one knows the answer to that, but the rise of other cryptos like Bitcoin Cash, Ethereum, Litecoin and Ripple may have dampened demand for Bitcoin. Some of these crypto currencies have faster transaction times and lower fees, and other usages, compared to Bitcoin. They are a lot cheaper, too, which may be appealing to those who missed the Bitcoin upsurge. That’s not to say, they will experience a similar rise to Bitcoin, but the potential is there. Investors may have also been put off buying Bitcoin at those elevated levels amid repeated warnings from experts about the way it had climbed near $20K. Sentiment was also hit by cyberattacks on two Bitcoin exchanges.
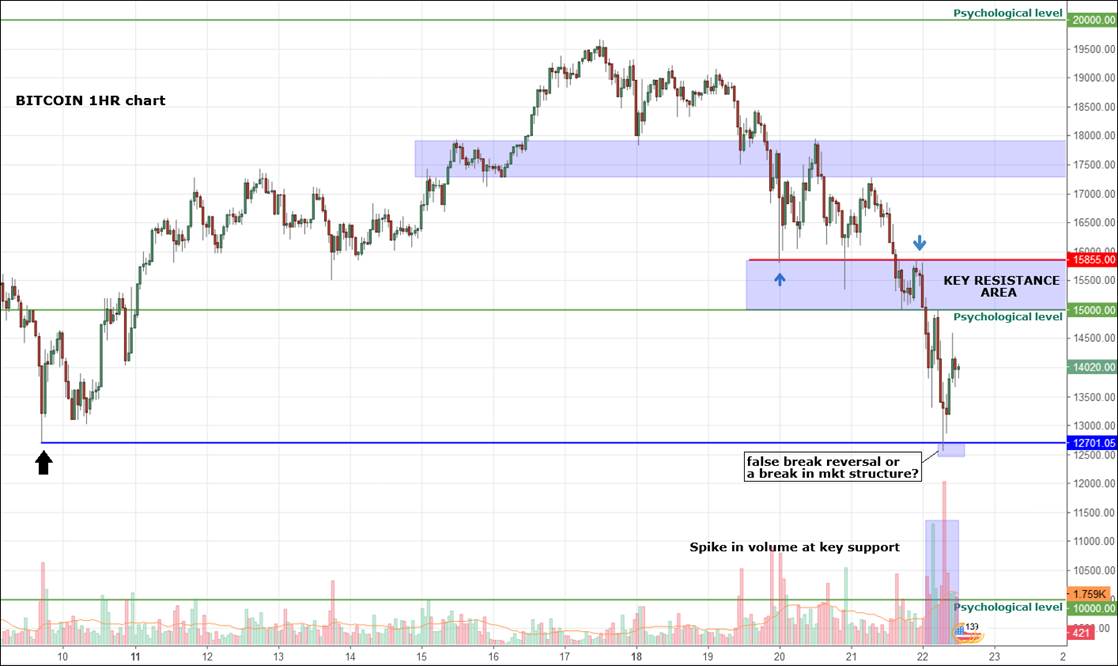
But now that Bitcoin has pulled back sharply, will the dip buyers step back in or will we see an even deeper retracement first? The only way I can even attempt an answer to that question is by looking at the chart of Bitcoin, using Technical Analysis. TA is the study of mass behavioural psychologically as the collective actions of the buyers and sellers are reflected in price changes, especially around levels where price had previously found strong support or resistance. As the crypto currencies don’t respond to economic data the way traditional currencies do, this makes them even more technically-friendly. On the point, the $12700 level is very important to watch as this was the previous low prior to the rally that ultimately ended near $20k. Price briefly breached this level earlier today before rebounding. Was that a false break reversal or a break in market structure? If Bitcoin now goes on to take out the next key resistance zone between $15000 and $15800 then it would confirm that this was a false break and thus a bullish reversal signal. However, if there is acceptance below the $12700 then we could see further losses in the days to come.
Author

Fawad Razaqzada
TradingCandles.com
Experience Fawad is an experienced analyst and economist having been involved in the financial markets since 2010 working for leading global FX, CFD and Spread Betting brokerages, most recently at FOREX.com and City Index.


