Bitcoin and Litecoin price prediction: BTC/USD takes a break before retest

Bitcoin could drop quickly to increase the volatility and complete the inverse H&S pattern
Bitcoin stalled at $11,500, as we foresaw yesterday, and it seems set to take a break before a serious attempt to break the resistance. The price is surrounded by important trendlines and a confluence of short-term and exponential long-term moving averages.
The moving average profile is manifestly upwards and the lines seem to converge at around $11,200. When lines converge, it is very common for daily price ranges to compress, as Bitcoin seems to be willing to do today.
BTC/USD is in the final stage of the mid-term inverse head and shoulders pattern, and the low volatility prevents a quick solution. There is, however, an interesting possibility that I want to explain in detail. The right shoulder hasn't been completely drawn, and all the figure's final part is still unclear. Therefore, there's a chance of an aggressive drop that would serve for two goals:
- First, to draw the figure completely. To do so BTC/USD should drop quickly to $8,000, be rejected at that level and rise swiftly to break the current level and develop a bullish trend.
-
Second, since the daily price range has decreased significantly, this quick move would increase the asset's volatility, increasing the daily range too.
BTC/USD 60 minutes chart

The hourly MACD has lost the 0 and shows a downwards profile with chances to keep dropping if the main supports are lost. The 100 moving average has been surpassed, although the price is still close to it. Below, the next support is at $11,075, followed by the 200 SMA at $10,870.
The Directional Movement Index signals sellers in full control. Purchasers have retreated and seem to acknowledge the levels. The ADX keeps rising, a positive signal for a downwards move.
LTC/USD 60 m
Litecoin hasn't followed Bitcoin's bullish path in the past days, mainly because it developed an upwards trend last week. It is, however, in a similar position, having broken a minor support and waiting now for the price to test the February's trendline main support at $204.85.
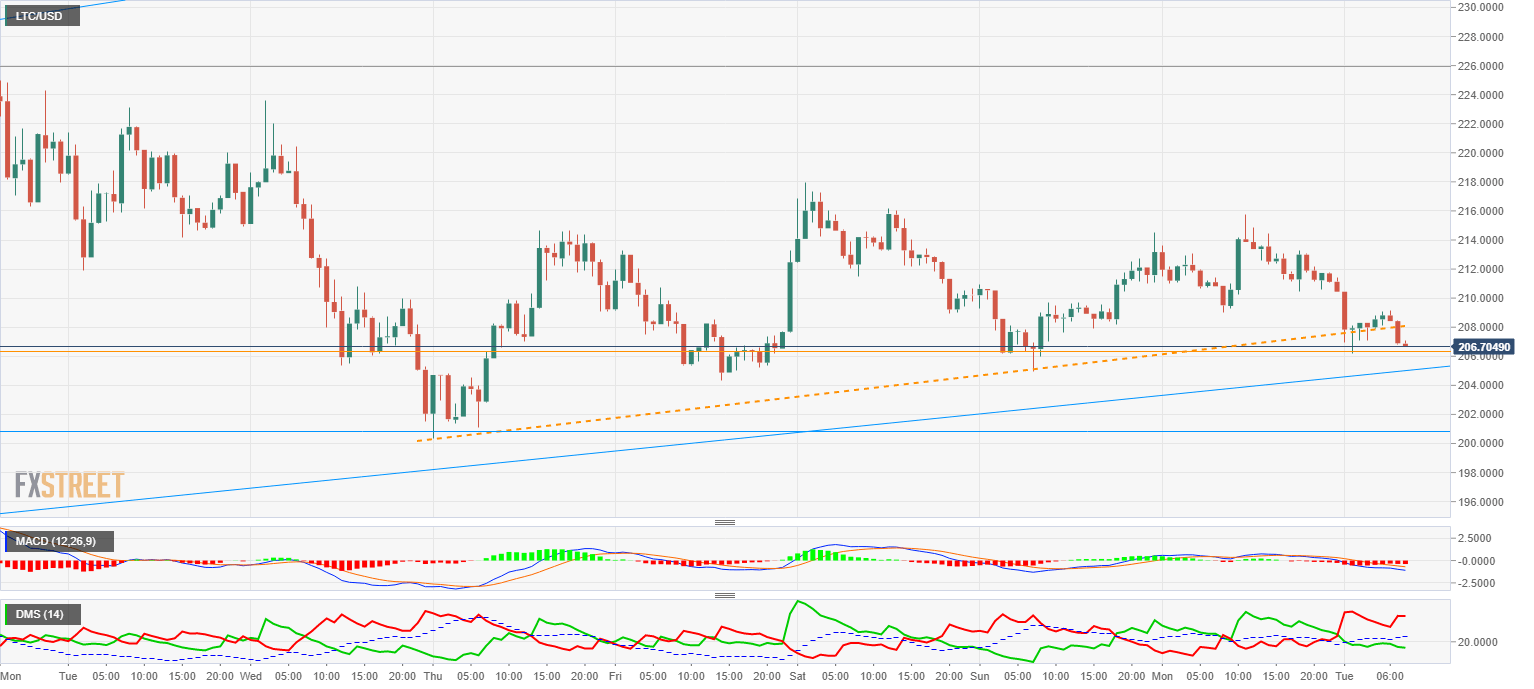
The MACD is similar to Bitcoin's, although less downwards. There are chances of an accelerated drop.
The Directional Movement Index shows again sellers in control, with purchases retreating. In this case, the ADX is not showing any sign of acceleration, although it is above 20, the level that is usually considered a trendsetter.
Takeaway
BTC/USD and LTC/USD are calm, but they have lost minor supports and we must be aware. There are chances for Bitcoin to develop a quick drop that would increase the volatility and complete the inverse H&S pattern before a bullish trend.
Author

Tomas Salles
FXStreet
Tomàs Sallés was born in Barcelona in 1972, he is a certified technical analyst after having completing specialized courses in Spain and Switzerland.


