Best price predictions for Bitcoin, Litecoin and Ripple: BTC/USD goal at $13500 if it gets rid of the obstacles

BTC/USD shows weakness in its upwards way. XRP/USD wakes up in the weekend and is bullish again.
BTC/USD 240 min
Bitcoin consolidates the $11,000 area and is testing the first of two close resistances that are the trace of the February 20 and 21 try to break the same price level.
Two weeks ago, the level to break was at $11,550. It was surpassed for 4 hours before being rejected in the subsequent candlestick. This move left the two key levels Bitcoin is facing now, the $11,550 we have mentioned and the move maximum at $11,764.83.
This is a complicated scenario, even more because the bullish trend since February minimums is almost exhausted.
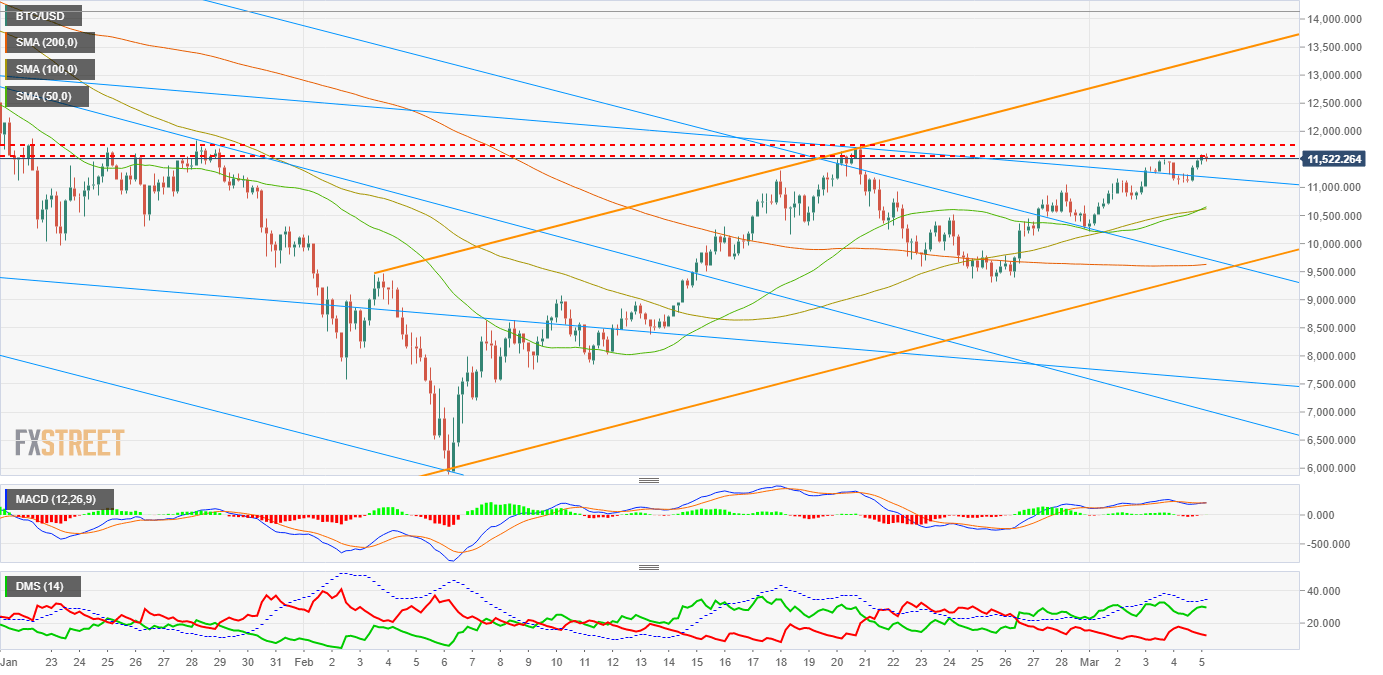
The MACD shows a slightly upwards slope, with the mean and the signal moving close to each other and no room for a consistent thrust.
The Directional Movement Index signals buyers in control, with a clear advantage with respect to sellers, that keep decreasing. The D+ moves below the ADX, denoting a late stage of the bullish trend.
Both indicators strengthen the idea that BTC/USD is not in a good shape to attack the resistances. The most likely scenario is a consolidation around $11,200 - $11,300.
LTC/USD 240 min
Litecoin keeps moving in a narrow range between $200 and $218 since last week. It is trading in the lower area of the bullish trend it has been describing since minimums, in a sloppy setting since any negative external news could take it below supports.
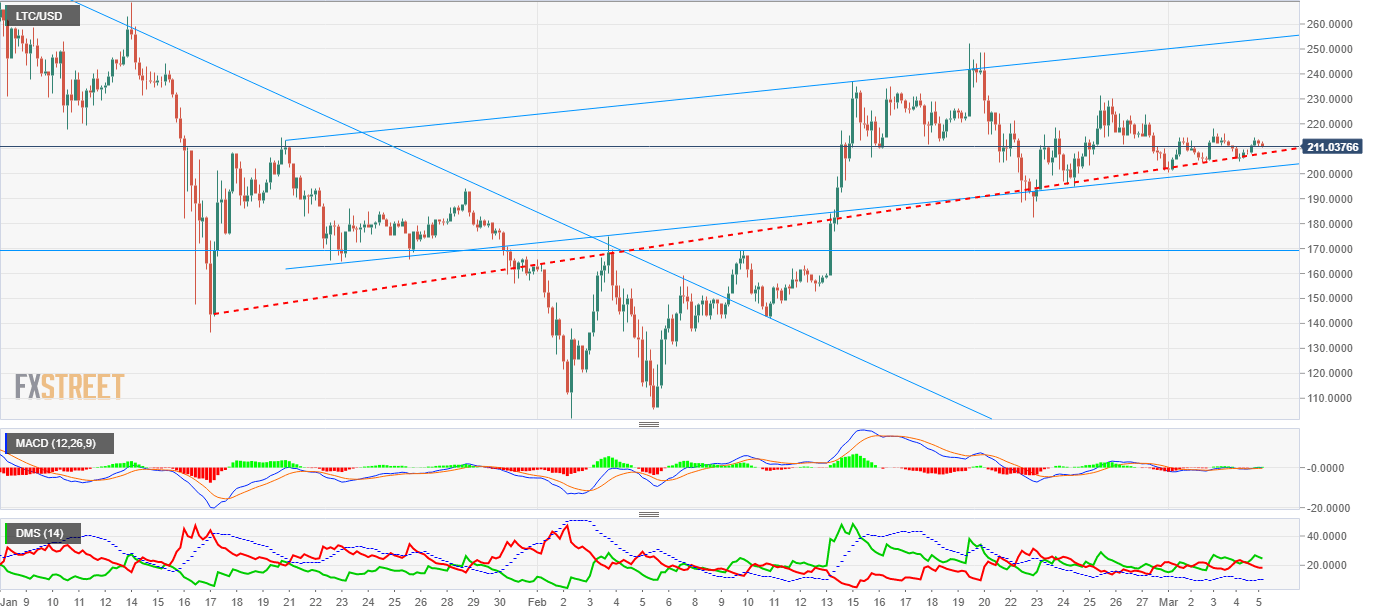
The MACD is moving just above 0 and almost flat. It conveys an absolute lack of direction and strength. This kind of scenarios are usually broken by a price shock, a critical event that provides volatility and suddenly wides the price range.
The Directional Movement Index shows sellers in control. The D-, selling strength indicator, shows a divergent profile with respect to price, so we must be cautious. The ADX is stagnated at very low levels and indicates almost no chances of a range increase without an external thrust.
XRP/USD 240 min
Ripple has developed a strong bullish move in the weekend and has got back the $1 key level. It is now trading around $1.04 after the price has been rejected at $1.084, and is inside an expansive triangle where it has room to muve upwards. Above the trendline that has stopped its previous attack, there is another resistance at $1.23. Should it break the days maximum, the way to the latter level would accelerate and we'd see important rises.
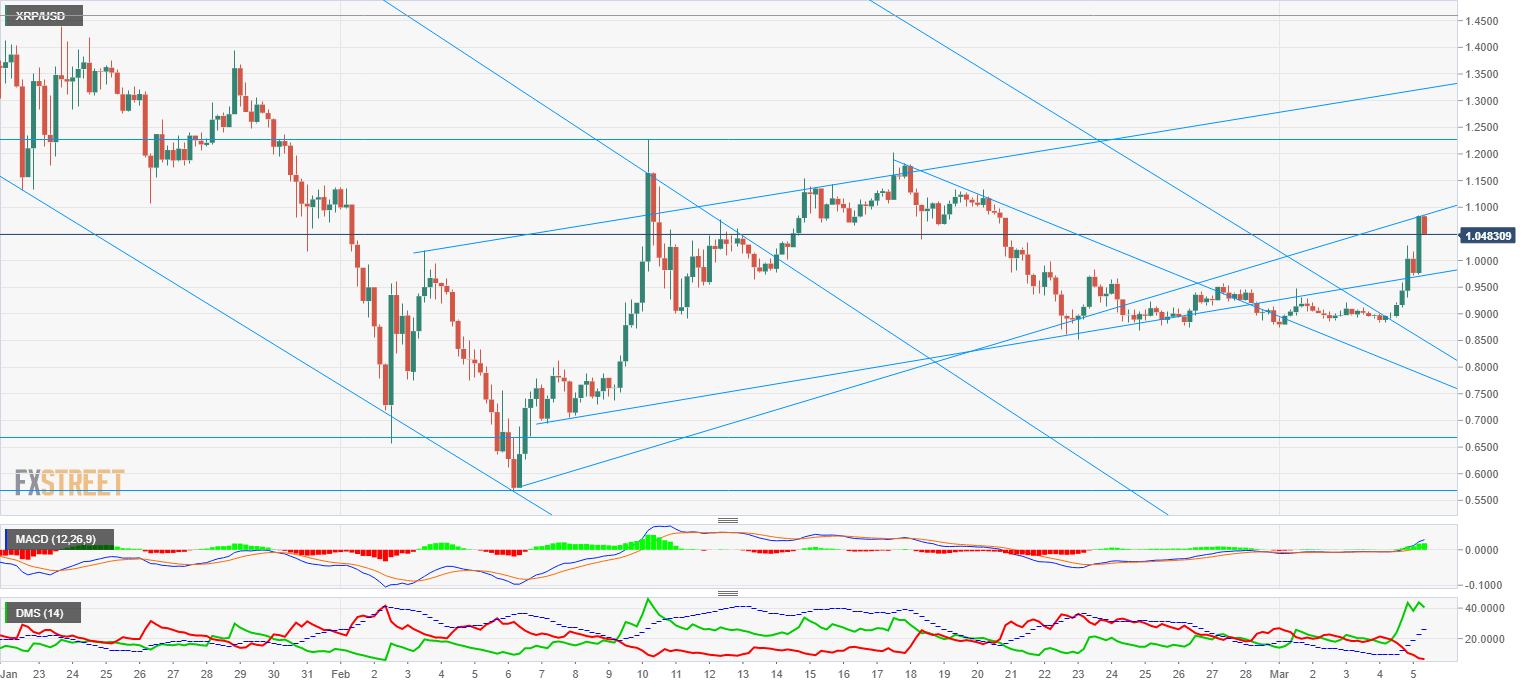
The MACD leverages the bullish move and shows an upwards slope. It is wider than before, and the mean-signal distance indicates more upwards movements.
The Directional Movement Index is also positive, with purchasers in full control. Sellers are at minimum levels and no one is betting for bullish movements. The ADX has woken up and shows a tendency strength, assessing the move's quality.
Author

Tomas Salles
FXStreet
Tomàs Sallés was born in Barcelona in 1972, he is a certified technical analyst after having completing specialized courses in Spain and Switzerland. He expanded his technical training following the guidance of great experts on the financial markets.


