|

Bank of America is eyeing all-time highs from 2006 [Video]

Bank of America (BAC) is one of the largest banks in the world, serving millions of consumers, businesses, and institutions. It has a broad mix of operations — consumer banking, wealth management, corporate banking, and global markets — which helps keep its earnings stable. The bank has been heavily investing in digital services and technology, aiming to improve efficiency and customer experience. Its size and global reach make it a key player in the U.S. and global financial system.

bacM
BAC Monthly Chart

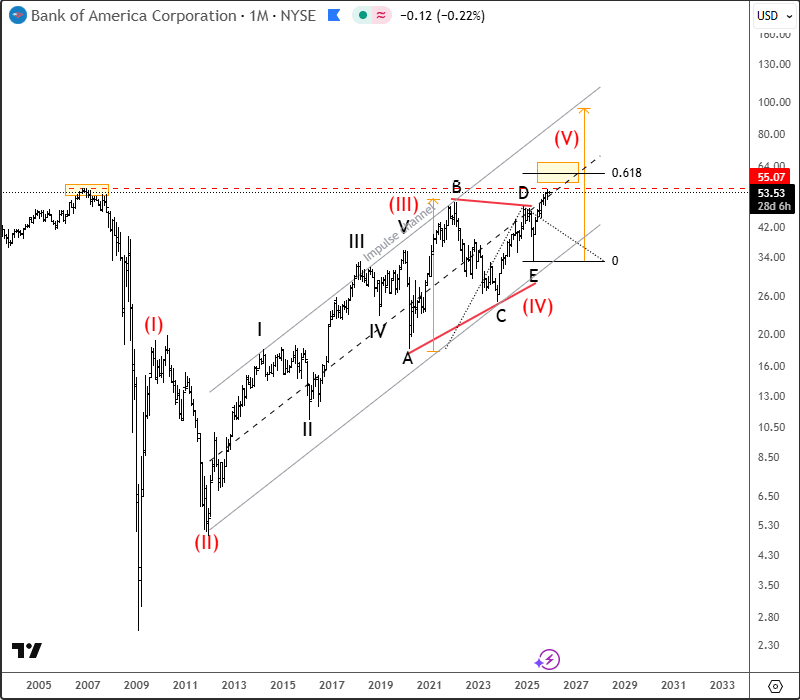
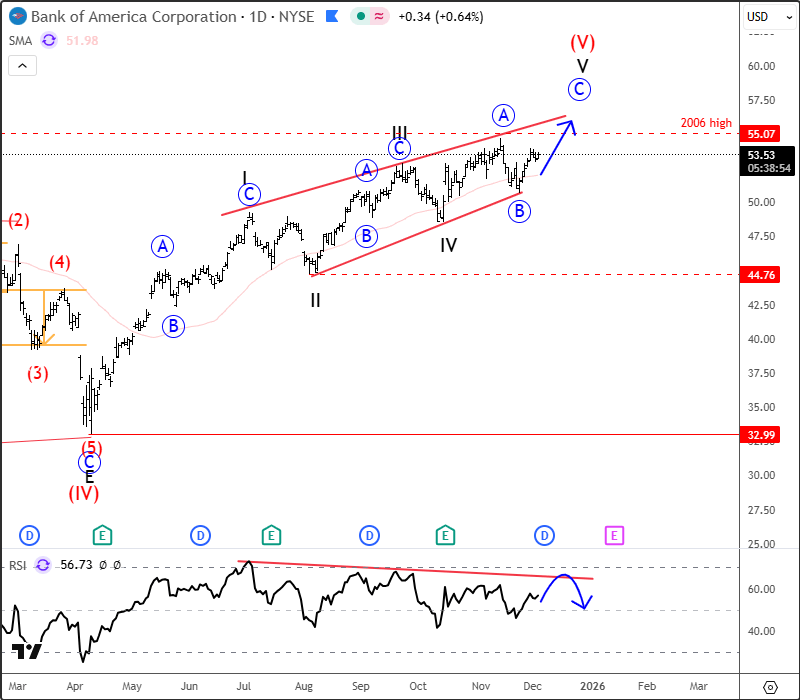
Bank of America is in an uptrend with a very strong rebound since April 2025, and the price is now approaching the 2006 highs. That area around 55 is extremely important because the current structure looks like an ending diagonal in wave five, meaning we could be in the late stages of a higher-degree bullish cycle. The push up this year also comes out of a very big triangle on the monthly chart, so despite the positive momentum, we should be aware that resistance is getting closer and bullish momentum may slow down. We also see RSI divergence on the daily chart, which is very common when diagonals mature. So while the trend is still up for now, it makes sense to be careful around 55, as a potential reversal in 2026 would not be a surprise.

bacD
BAC Daily Chart

Highlights

Trend: Bullish but late-stage (ending diagonal risk).
Resistance: 55-56 area (2006 high).
Invalidation of a bull trend: broken trendline support.
Note: Watch RSI divergence and respect the 55/56 zone as potential exhaustion of wave five.

For more analysis like this, you may want to watch below our latest recording of a live webinar streamed on December 01:

Youtube preview

Get Full Access To Our Premium Elliott Wave Analysis For 14 Days. Click here.

Author

Gregor Horvat

Gregor Horvat

Wavetraders

Experience Grega is based in Slovenia and has been in the Forex market since 2003.

More from Gregor Horvat
Share:

Markets move fast. We move first.

Orange Juice Newsletter brings you expert driven insights - not headlines. Every day on your inbox.

By subscribing you agree to our Terms and conditions.

Editor's Picks

EUR/USD edges higher to mid-1.1600s; looks to US PCE Price Index for fresh impetus

The EUR/USD pair attracts some dip-buyers during the Asian session on Friday and recovers a part of the previous day's retracement slide from the 1.1680 region, or the highest level since October 17. Spot prices currently trade around mid-1.1600s and remain on track to register gains for the second straight week.

GBP/USD: Constructive view prevails above 1.3300 ahead of US PCE inflation data

The GBP/USD pair trades on a flat note near 1.3330 during the Asian trading hours on Friday. Traders prefer to wait on the sidelines ahead of the key US inflation report later on Friday. The US delayed Personal Consumption Expenditures Price Index report for September could offer some hints about the US interest rate path.

Gold bull-bear tug-of-war extends ahead of US data

Gold struggles around $4,200 early Friday, eyes a modestly flat close to the week. US Dollar turns south alongside Treasury bond yields amid Fed rate cut buzz. Gold remains confined within a tight range; buyers refuse to give up yet.

Top Crypto Gainers: Zcash rallies as MYX Finance, Dash test critical EMA levels

Zcash, MYX Finance, and Dash are the top-performing assets in the top 100 cryptocurrency list over the last 24 hours. The privacy coin leads the rally while MYX and DASH struggle to clear their 100-day Exponential Moving Averages.

Why the Fed may cut rates in December: Understanding the policy shift

The Fed has gone through a noticeable policy swing in recent months - from initiating a rate cut, to signaling a potential pause, and now shifting once again toward another cut in December. This has created understandable confusion among traders and investors trying to interpret the Fed’s reaction function.

XRP edges lower despite record on-chain activity and steady ETF inflows

Ripple is trading under pressure at the time of writing on Thursday, after bulls failed to break the short-term resistance at $2.22. The reversal may extend toward Monday’s low of $1.98, especially if risk-off sentiment persists in the broader cryptocurrency market.