AUZ/NZD – Ending wedge highlights a possible medium-term top

Breaking down the timeframes
Background: Not a normal cross that I cover but I have got a bearish set up this morning. The AUD got a boost overnight from better-than-expected Chinese exports. That drove AUNZD higher into the sell zone
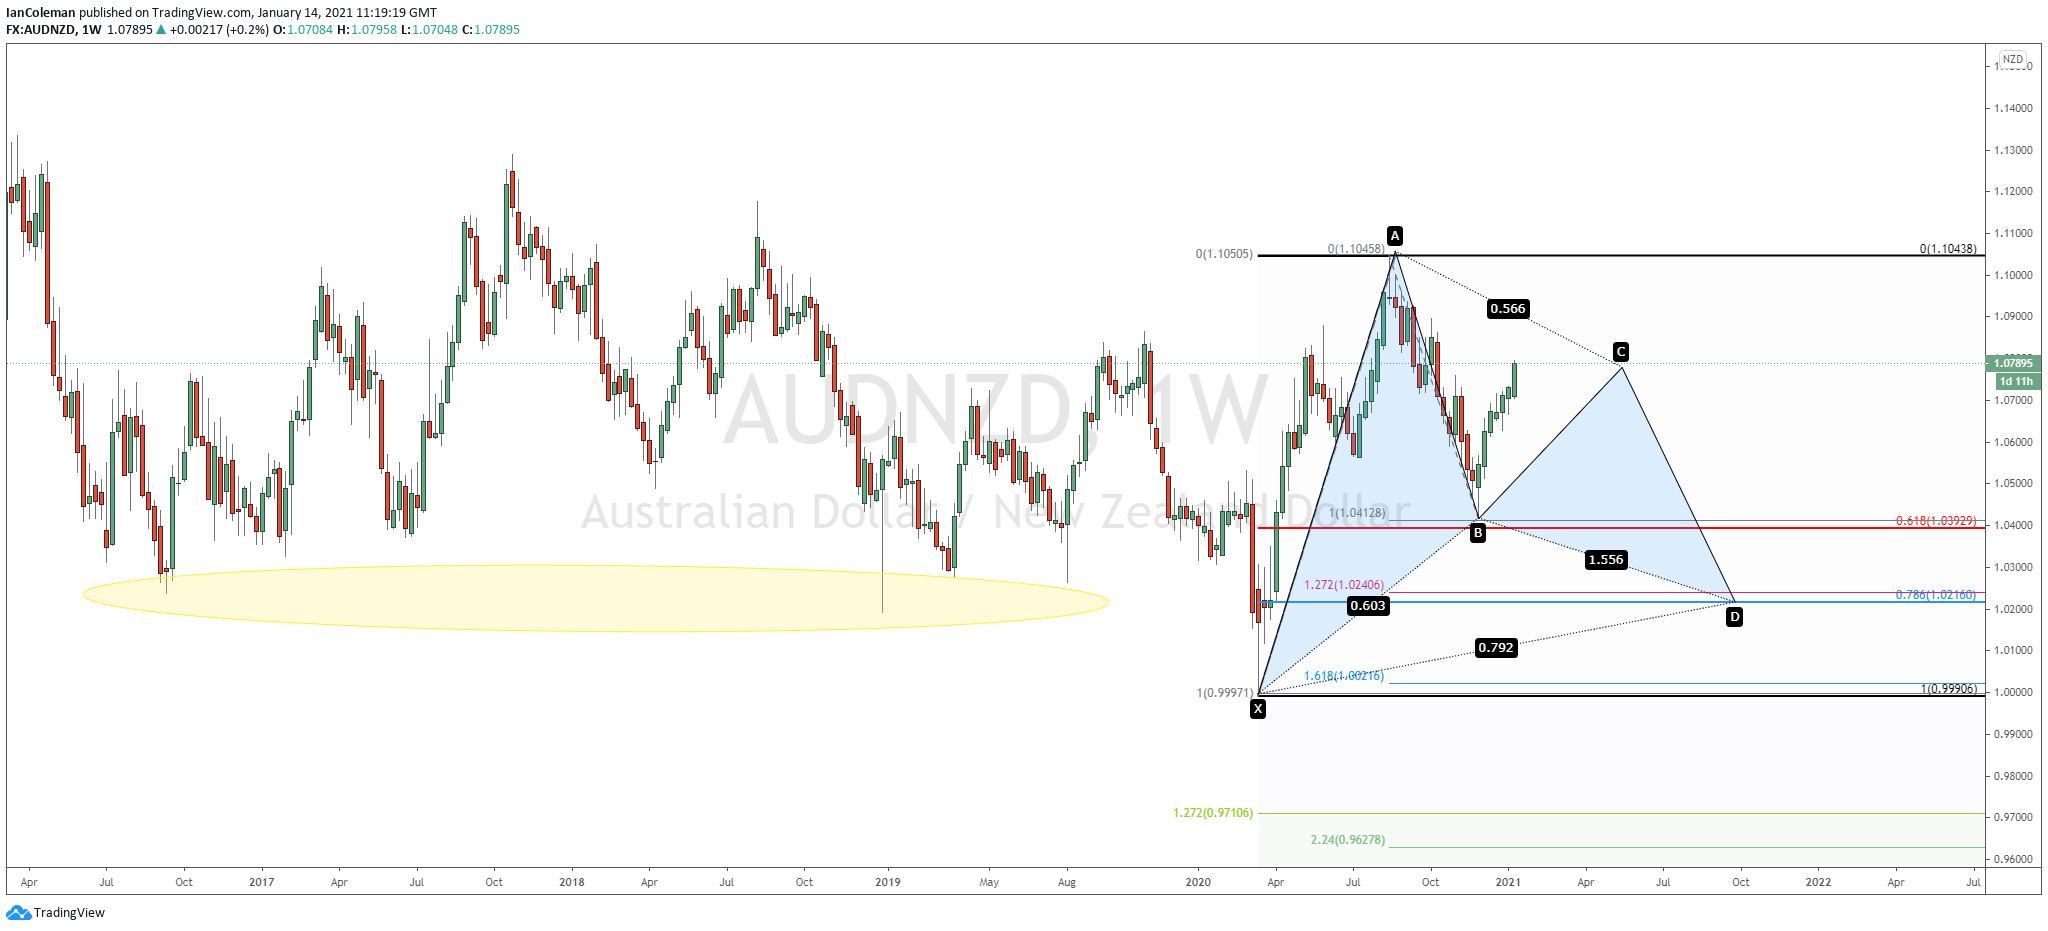
AUD/NZD – weekly
On the week 30 th November 2020 the cross stalled and reversed close to the 61.8% pullback level of 1.0392. From a Cypher pattern viewpoint, this could mean that we are in the BC leg of a larger Gartley formation. This would indicate that the next leg lower is CD to finalize the pattern close to 1.0240-1.016. This is the medium-term target area
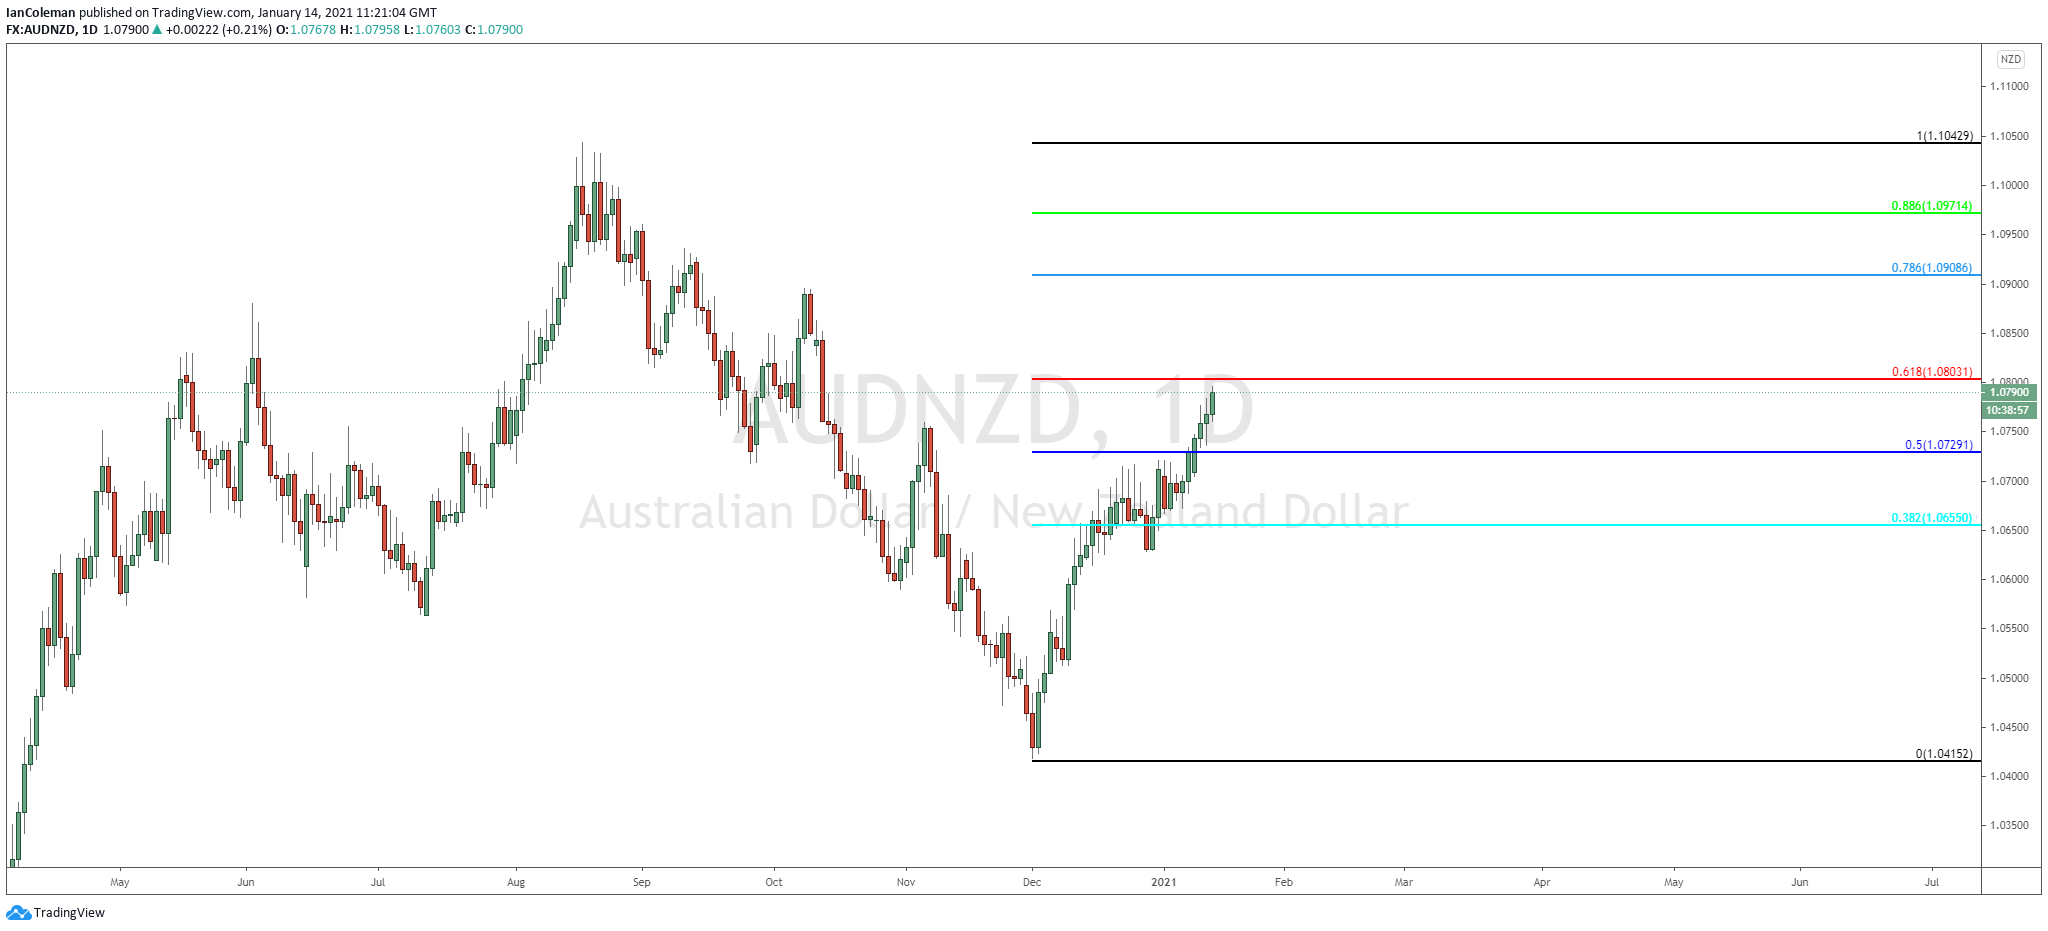
AUD/NZD Daily
The 61.8% Fibonacci level is seen at 1.0803.
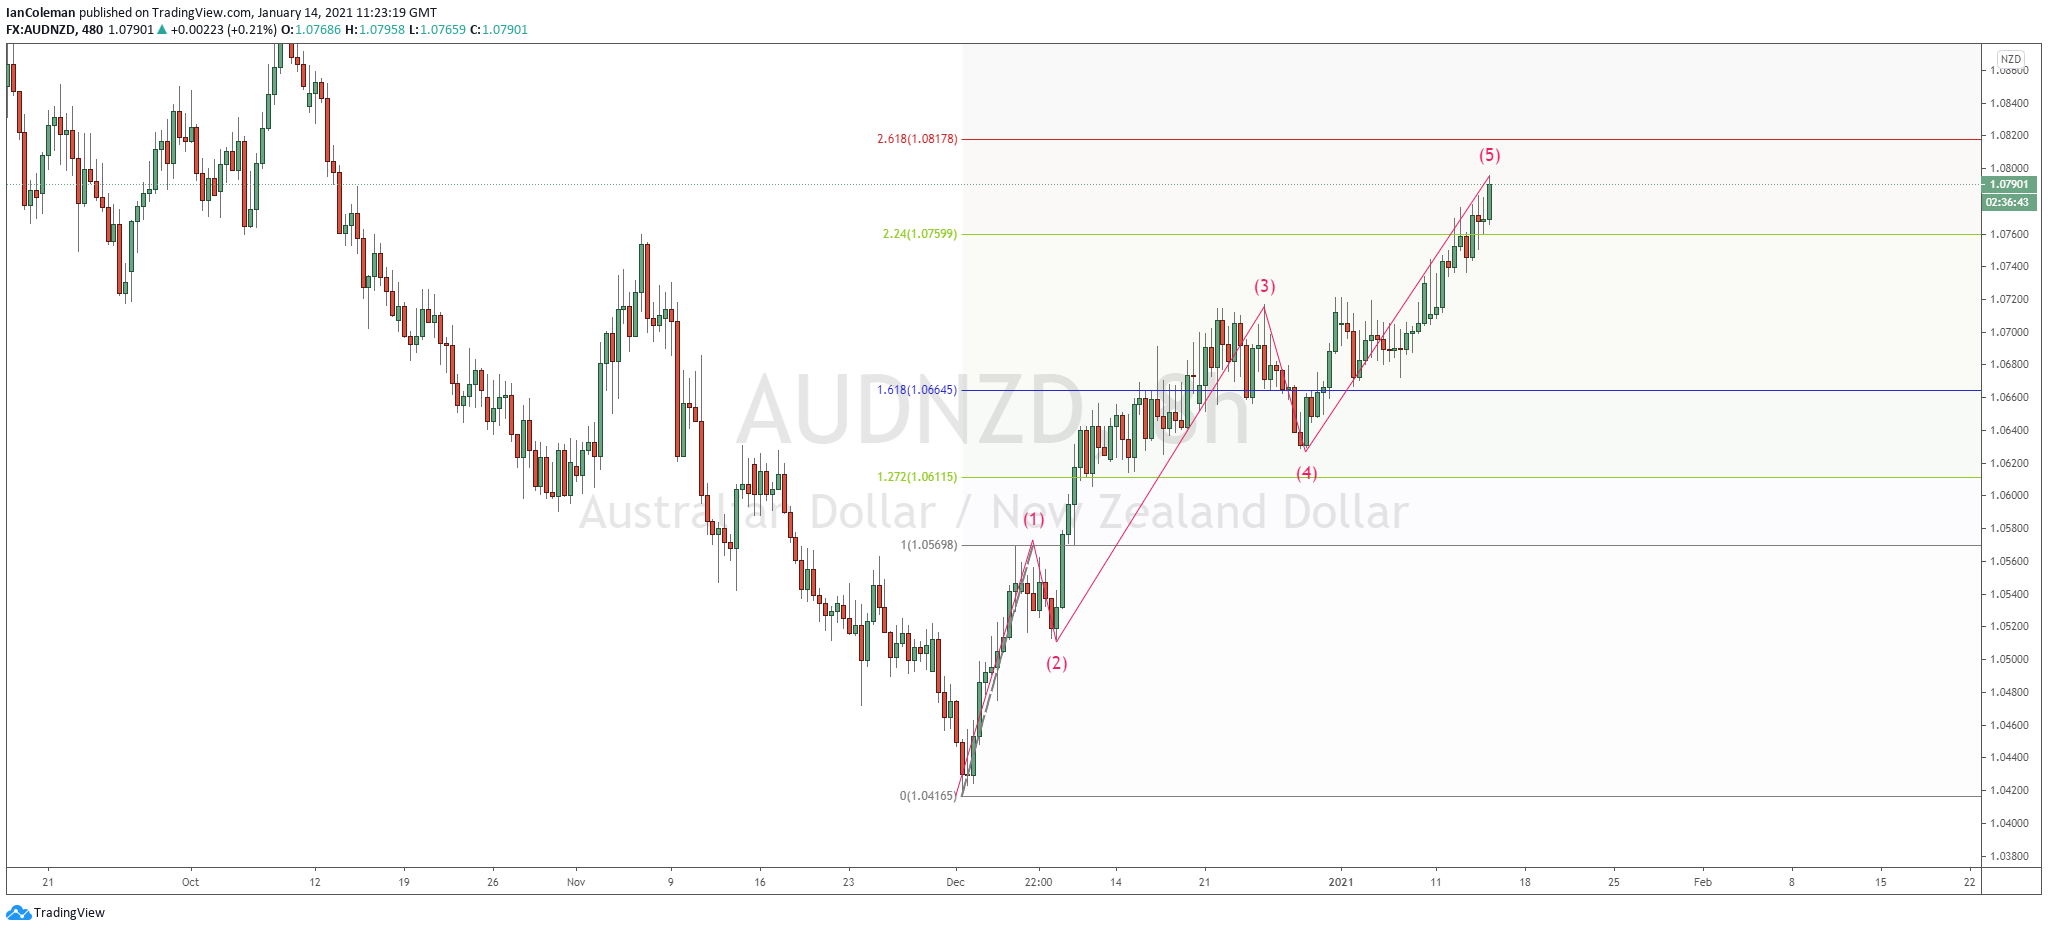
AUD/NZD eight-hour
From an Elliott Wave viewpoint, are we now completing the 5 th wave? The end of the trend.
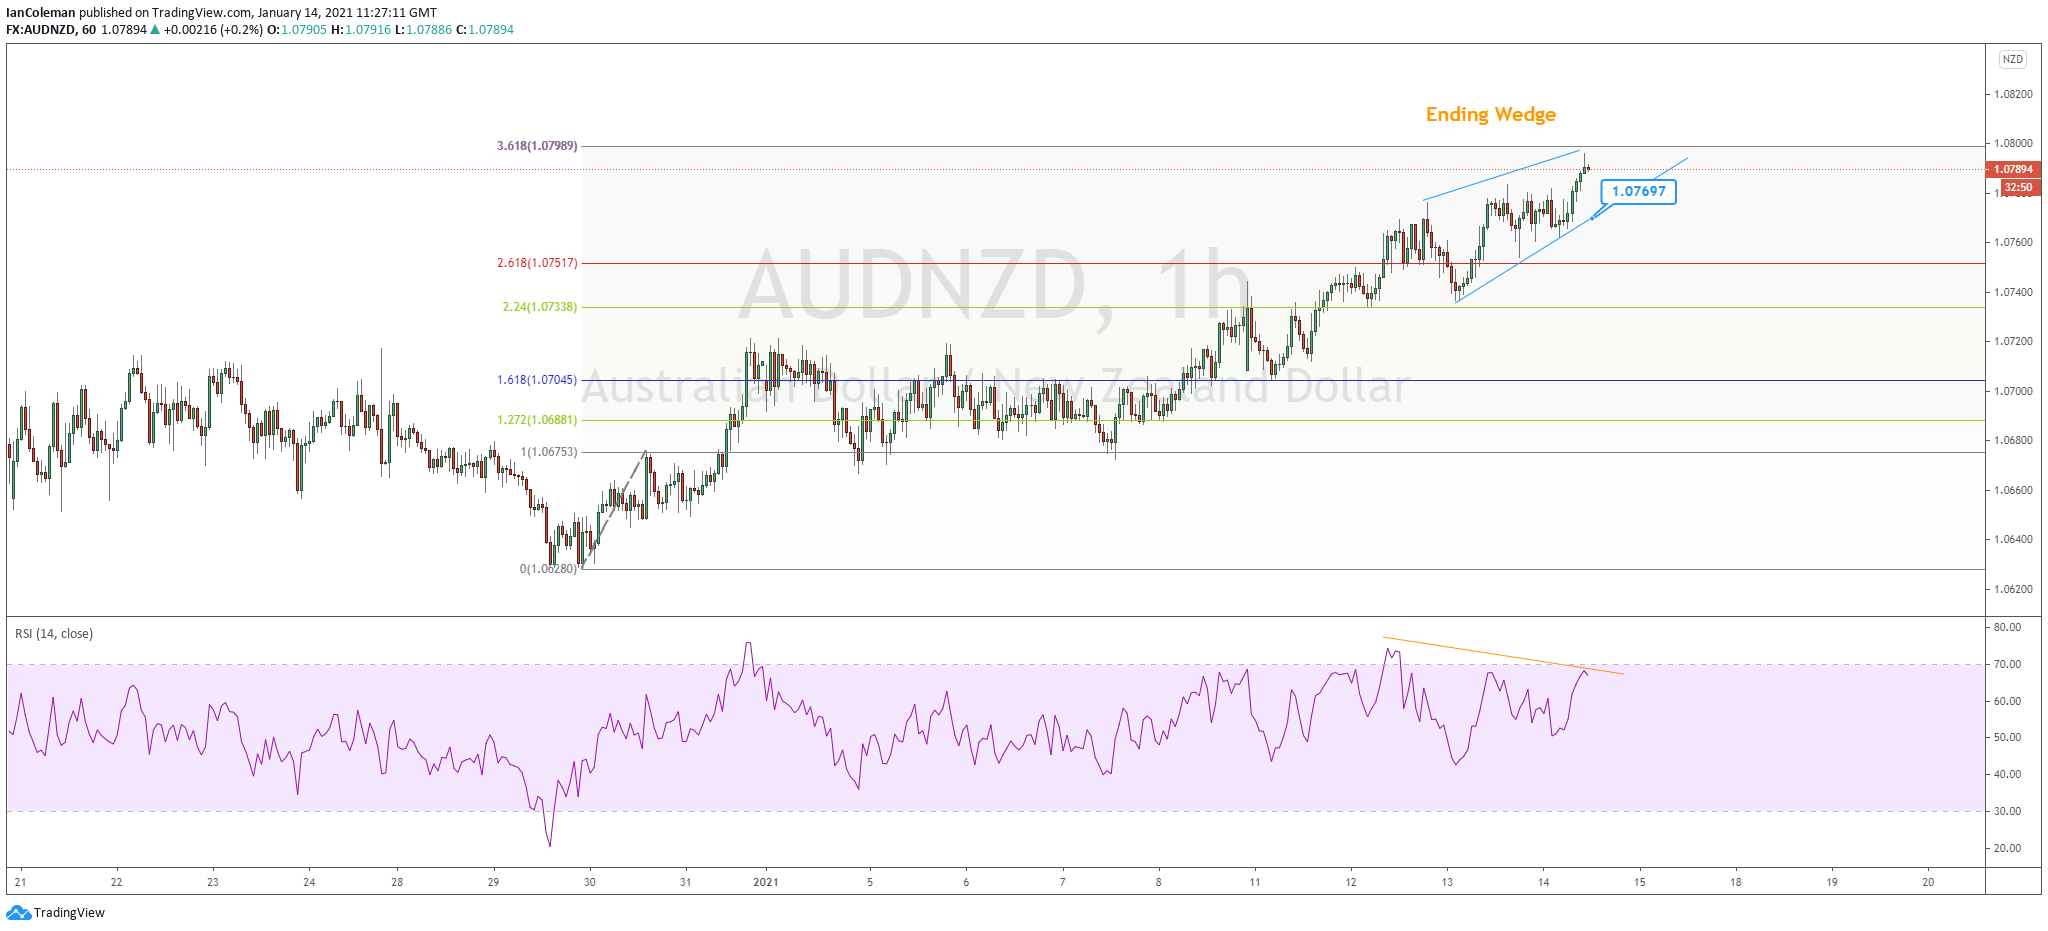
AUD/NZD one-hour
Looks to have formed a bearish Ending Wedge pattern. This formation is often seen at the top of a trend and the start of a new downward bias. A break of support (1.0769) would confirm the breakout. We can also note bearish divergence (chart makes a higher high while the RSI makes a lower high).
Author

Ian Coleman
FXStreet
Ian started his financial career at the age of 18 working as a Junior Swiss Broker at Godsell Astley and Pearce (London). He quickly moved through the ranks and was Desk Manager at RP Martins at the age of 29.


