Australian Q3 GDP Preview: Data could cement further rate cuts from RBA and weigh on AUD
- AUD/USD capped at a key 61.8% Fibonacci level of 0.6862 post-RBA rally.
- RBA statement confirms RBA on hold, but dovish bias persists.
- GDP data could give the market a case for further rate cuts.
- Bulls will seek a break of 2019 trendline around 0.6930.
- Bears will look to break below the 50-day moving average ahead of a run to 0.6724 October 16 low.

So, we will have had a triple whammy this week for Aussie traders by the time today's domestic Gross Domestic Product data is released. The event is scheduled for 00:30 GMT. Australia's GDP figures are forecast to have shown a small slowing in growth from last quarter, with growth printing at 0.3% QoQ and annual growth slowing to 1.5% YoY - not a bullish case for the nation's battered currency. However, the RBA statement gave a kick start to the bulls, but the GDP data may make for a shortlived time spent at the key 61.8% Fibonacci level of 0.6862.
Description
The Gross Domestic Product released by the Australian Bureau of Statistics is a measure of the total value of all goods and services produced by Australia. The GDP is considered as a broad measure of economic activity and health for which the RBA keenly monitors for its monetary policy decisions. While prospects of the need for quantitative easing from the Reserve Bank of Australia, it hasn't taken long for the market's attention to revert back to the bigger picture for a second glace. The likelihood of such drastic measures definitely depends on this week's critical data and will be a crucial event for the Aussie. A rising trend in GDP has a positive (or bullish) effect on the AUD, while a falling trend is seen as negative (or bearish) for the AUD.
AUD market backdrop and conditions
For some background on the currency and current market conditions, the Australian dollar has had its fair share of the market's supply of late.
The currency had taken a blow from the highest levels since the mid-summer levels on the 0.69 handle to below a 61.8% Fibonacci retracement of the said month to date range while supported down in the 0.6750s. The Chinese manufacturing double whammy coupled with weakness in US data gave the bull's a pre-Reserve Bank of Australia boost from 0.6785 and the vicinity of the 200-hour moving average's resistance area and onto a high of 0.682. AUD/USD consolidated there during Asia ahead of the RBA.
Since the RBA, the currency has seen a fresh three-week high meeting a 61.8% Fibonacci retracement of the late Oct swing highs and late November low. The price was rejected there and sent back to a pre-GDP data 50% mean reversion level of the same range at 0.6840. There had also been some downside back to the 21-hour moving average support at 0.6815.
Indeed, the RBA was a consideration for traders yesterday, but knowing that the GDP was yet to come, the central bank was unlikely to make any major call of any sort. Markets had only been factoring in around a 10% chance of easing at the December meeting.
RBA event, key notes
- The RBA Board kept the cash rate at 0.75% in December.
- The AUD and interest rates jumped on the statement.
- AUD/USD was trading at 0.6820 and rallied to 0.6862.
- The comment that “while the [global] risks are still tilted to the downside, some of these risks have lessened recently,” was a driver.
- House prices "have also increased recently” was another positive in the statement.
- The statement about employment continuing “to grow strongly” has been removed entirely, yet market did not seem to capture that and could be a risk going forward.
- In the statement, the change to the last paragraph was made, stating, “the long and variable lags in the transmission of monetary policy” – could also have been a bullish factor for AUD as being a reason to hold.
GDP expectations
One of the top leading indicators for Australian GDP are the business indicators. These have been generally disappointing for Q3.
Analysts at ANZ Bank explained that the business inventories and profits both missed expectations by a solid margin, while overall sales volumes fell." Small business profits and wages grew moderately. Together, these numbers suggest some downside risk to our Q3 GDP forecast of 0.6% q/q, due on Wednesday", the analysts argued.
Other indicators to consider would be manufacturing, unemployment claims, trade balance (with a particular focus on the net export contribution to growth), retail sales and consumer confidence. On balance, all of these areas have been at best, lacklustre, albeit at times showing some glimmers of improvements. Business and consumer confidence have been lifting and while exports have been a large factor in ensuring the economy is nowhere near a recession. However, the weakness of the private sector and the need for government spending have highlighted one of the weakest economies Australia has faced since the Global Financial Crisis. In fact, the last GDP figures showed the worst annual economic growth for 18-years – nothing has really improved.
Implications for RBA and AUD/USD
For today's release, the most optimistic of observers would be looking for improvements in overall growth, but the data needs to impress above expectations considering the weak inflation growth outlook which is tracking below potential. The nuts and bolts of the report will determine the market's forecast when it boils down the RBA's subsequent action in time to come. The markets will price in the data and RBA outlook into the Aussie.
A slowing in quarterly growth will likely see further reassessments of the nation's forecasts and will likely spark-up a dovish bias/outlook, in contrast, the RBA's current take that the nation is at a ‘gentle turning point’ – ultimately a weight on the Aussie.
Analysts at the National Bank of Australian are less optimistic than the RBA in saying that growth will return to trend and that there will be an improvement in the unemployment rate:
"Consequently, we see the RBA cutting the cash rate by a further 25bps in February, with the risk of further cuts and a move to an unconventional policy by mid-year should a material fiscal stimulus fail to materialise."
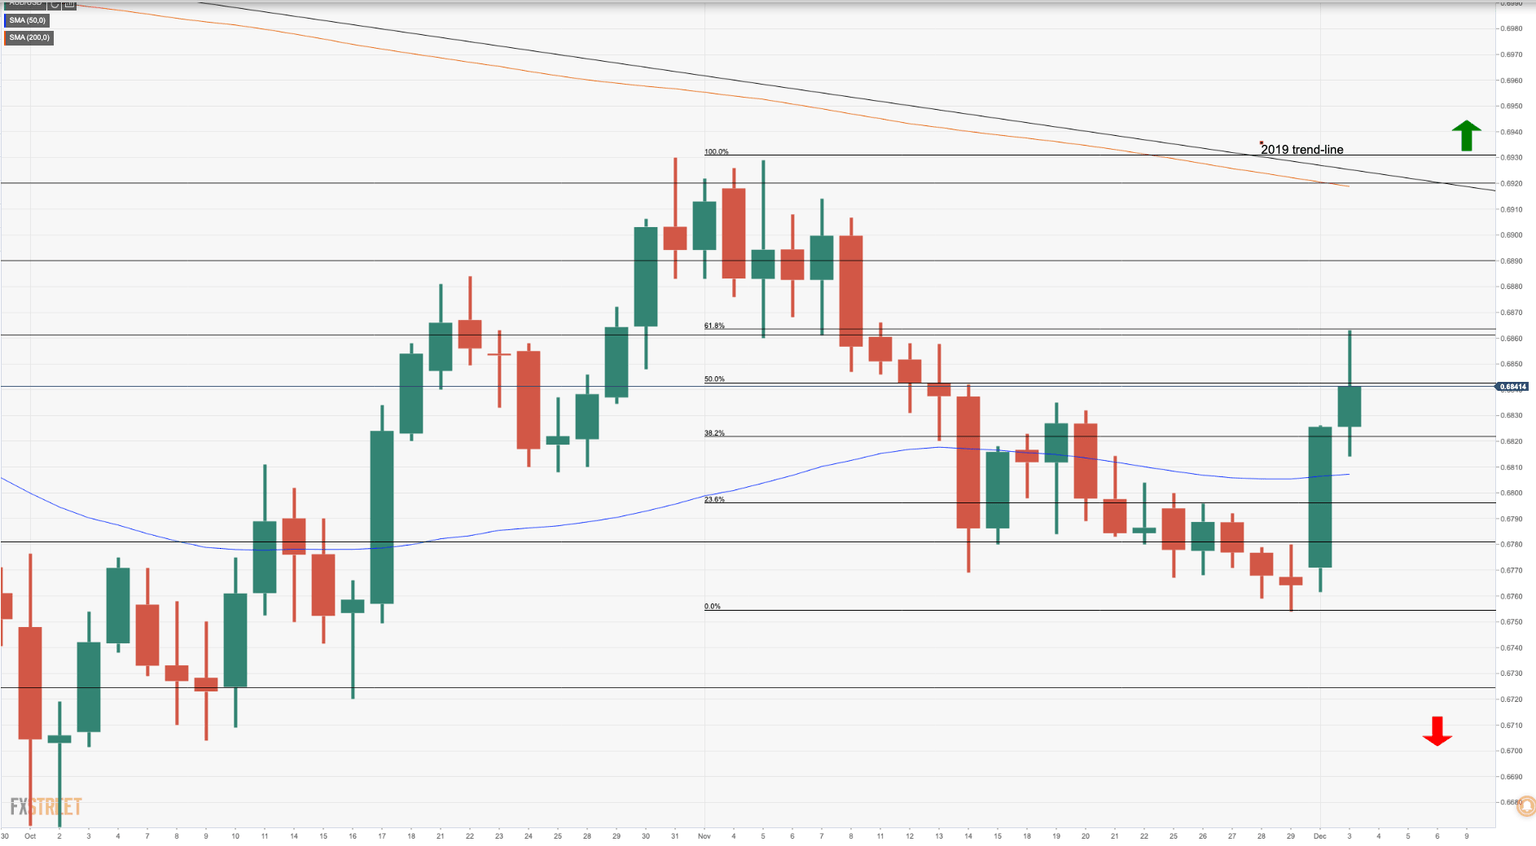
AUD/USD daily chart
AUD/USD levels to consider
Bullish targets
- 0.6861
- 0.6890
- 0.6920
- 0.7030
Bearish targets
- 0.6815/30
- 0.6780
- 0.6724
- 0.6671
On a bullish outcome for AUD, working our way in on the widest projection, taking into consideration the Fibonacci retracements targets of the 2018-YTD range, AUD/USD bulls will seek a break of the 2019 downtrend around 0.6890 ahead of the descending 200-day moving average located around 0.6920 before hunting down the 23.6% Fibo of said range, located around 0.7030. First, the 61.8% Fibonacci retracement of the late Oct swing highs and late November low at 0.6861 needs to give. The price was rejected thereafter the RBA and sent back to a pre-GDP data 50% mean reversion level of the same range at 0.6840.
On a bearish outcome, initial support offered by the 50-day moving average and convergence of the 21-hour moving average comes in at around the day's lows of between 0.6815/30. We then have the 4-hour convergence of the 50 and 21 4-hour moving averages around 0.6780. This is a level that guards the next level of support at 0.6724 October 16 low ahead of the 0.6671 October low.
Author

Ross J Burland
FXStreet
Ross J Burland, born in England, UK, is a sportsman at heart. He played Rugby and Judo for his county, Kent and the South East of England Rugby team.


